Transport for NSW
L o a d i n g
Transport for NSW (TfNSW) is a New South Wales government transport and road agency established on 1 November 2011. The agency is a different entity to the New South Wales Department of Transport, a department of the New South Wales Government and the ultimate parent entity of Transport for NSW
Available DatasetsShowing 232 of 232 results
- This dataset contains NSW Trainlink train and coach (bus) utilisation figures. The data is aggregated to a total monthly figure representing the estimated number of trips. The resource captures the service number, service name and the monthly figures for each service.2last year
- **On Demand Public Transport Services - Patronage** This dataset contains the monthly patronage data for On Demand Public Transport services. * The numbers represent total successful trips (ie. where the passenger boarded and alighted the vehicle – excluding customer cancellations, no-shows, and rejected bookings) * Each service is unique and due to varied service offerings, operating days and times, and vehicle numbers and capacity, patronage numbers between services are expected to differ and therefore should not be used as the sole indicator when comparing performance * Data collection and validation processes on the part of both operators and TfNSW are improving continuously, so data may be amended from time to time to ensure that patronage is reported as accurately as possible * Due to robust data validation processes between TfNSW and operators, final patronage figures may not be available until a few weeks after the end of a reporting month3last year
- These datasets contain the total number of Driver and Rider Testing transactions. The data includes: * The count (number) of driver and rider test per month for a given year. * The count of computer based tests per month for a given year. Data will be updated to include the backdated transactions in the previous 2 months. Interactive analytics from 1 July 2022 is available on Registration and Licensing Statistics Portal [https://www.transport.nsw.gov.au/registration-and-licensing-statistics-p...](https://www.transport.nsw.gov.au/registration-and-licensing-statistics-portal) Information prior to 1 July 2022 is available on Webstats [https://roads-waterways.transport.nsw.gov.au/cgi-bin/index.cgi?action=st...](https://roads-waterways.transport.nsw.gov.au/cgi-bin/index.cgi?action=statstables.default) Disclaimer: Transport for NSW (TfNSW) publishes statistical licensing and registration data to disseminate information and provide transparency for the benefit of the public. TfNSW has taken care to ensure that data published is correct and accurate as possible. The data has been consistently produced and is updated regularly. However, TfNSW does not warrant, represent or guarantee the accuracy, reliability, quality or suitability for any purpose of the information or data published at this website nor accept any responsibility arising in connection with any errors in, or omissions from, the information or data provided. TfNSW does not accept any legal liability for any loss or damage arising directly or indirectly from the use of information or data published at this website. TfNSW recommends that users exercise their own skill, care and judgement with respect to their use of information or data published including by evaluating the relevance of the material on this website for their purpose.3last year
- This dataset contains Official Bus Utilisation figures. Opal tap-on/tap-off data (representing an individual boarding and alighting a bus) is aggregated to a total monthly figure representing the estimated number of trips. Starting July 1, 2024, the methodology for calculating trip numbers for individual lines and operators will change to more accurately reflect the services our passengers use within the transport network. This new approach will apply to trains, metros, light rail, and ferries, and will soon be extended to buses. Aggregations between line, agency, and mode levels will no longer be valid, as a passenger may use multiple lines on a single trip. Trip numbers at the line, operator, or mode level should be used as reported, without further combinations.More information on NRT ROAM can be accessed [here](http://opendata.transport.nsw.gov.au/dataset/roam-rail-opal-assignment-model) \*\*Caution \*\* 1. School Student travel using concessional Opal cards is included. However this may be underrepresented, due to inconsistent tap-on/tap-off behaviour by students 2. Magnetic Stripe Ticketing (MST – paper tickets) data was also available in July 2016. MST patronage data for July is available [here](https://www.transport.nsw.gov.au/newsroom-and-events/reports-and-publications/magnetic-stripe-ticketing-mst-patronage-data-july-2016) 3. Opal data may be subject to minor revision for the two months following upload 4. Data is static at a point in time, and may not match other reports that are real time 5. All non-Opal travel is excluded, for example transport concession entitlement cards, integrated ticketing for major events, and fare non-compliance 6. An Opal Trip is defined as a tap-on/tap-off pair (including where only a single tap-on or tap-off is recorded) 7. 'Other' group under bus contract includes NightRide and Unallocated. 8. Keolis Downer Hunter took over the Newcastle Bus franchise from Newcastle Buses (State Transit Authority) effective 1 July 2017. The contract area NISC1 reflects this and Keolis Downer Hunter figures for Jul 2017 onwards are included as part of Private Bus Operator numbers. From January 2018 NISC1 includes non-Opal categories of On Demand and Other. The category ‘Other’ includes: Fare Free Zone, Integrated Ticketing, Free Travel Passes, Route 110 Newcastle City Loop, Park and Ride, and Special Events. 9. Transit Systems West took over the Sydney Metropolitan Bus Service Contract 6 from Sydney Buses (State Transit Authority) effective 1 July 2018. The contract area SBSC Contract 6 reflects this and Transit Systems West figures for Jul 2018 onwards are included as part of Private Bus Operator numbers. 10. Figures in Jul 2017 for Newcastle Buses reflect services operated by STA which completed post-midnight 30 June 2017. 11. NightRide services are included in Sydney Metropolitan Bus Services Contract (SMBSC) areas from 1 March 2018 onwards. 12. Keolis Downer Northern Beaches took over the Sydney Metropolitan Bus Service Contract 8 from Sydney Buses (State Transit Authority) effective 31 October 2021. The contract area Greater Sydney Bus Contract 8 (GSBC008) reflects this and Keolis Downer Northern Beaches figures for Nov 2021 onwards are included as part of Private Bus Operator numbers. 13. Busways North West took over the Sydney Metropolitan Bus Service Contract 7 from Sydney Buses (State Transit Authority) effective 9 January 2022. The contract area Greater Sydney Bus Contract 7 (GSBC007) reflects this and Busways North West figures for Jan 2022 onwards are included as part of Private Bus Operator numbers. 14. Transdev John Holland took over the Sydney Metropolitan Bus Service Contract 9 from Sydney Buses (State Transit Authority) effective 3 April 2022. The contract area Greater Sydney Bus Contract 9 (GSBC009) reflects this and Transdev John Holland figures for April 2022 onwards are included as part of the Private Bus Operator numbers. 15. CDC NSW took over Sydney Metropolitan Bus Service Contracts 12 and 14 from Transdev and Forest Coaches, effective 21 May 2023. The contract area Greater Sydney Bus Contract 14 (GSBC014) reflects this and CDC NSW figures after 21 May 2023 are included as part of the Private Bus Operator numbers. 16. U-Go Mobility took over Sydney Metropolitan Bus Service Contracts 05 and 10 from Punchbowl and Transdev NSW, effective 1 July 2023. The contract area Greater Sydney Bus Contract 10 (GSBC010) reflects this and U-Go MObility figures after July 2023 are included as part of the Private Bus Operator numbers. 17. Transit Systems NSW took over Sydney Metropolitan Bus Service Contracts 3 and 13 from Transit Systems and Transdev NSW, effective 6 August 2023. The contract area Greater Sydney Bus Contract 3 (GSBC003) reflects this and Transit Systems NSW figures after 6 August 2023 are included as part of the Private Bus Operator numbers. 18. Transit Systems NSW SW took over Sydney Metropolitan Bus Service Contracts 2 and 15 from Interline and Busabout, effective 8 October 2023. The contract area Greater Sydney Bus Contract 2 (GSBC002) reflects this and Transit Systems NSW SW figures after 8 October 2023 are included as part of the Private Bus Operator numbers. 19. Busways R1 took over Sydney Metropolitan Bus Service Contracts 1, effective 10 December 2023. The contract area Greater Sydney Bus Contract 1 (GSBC001) reflects this and Busways R1 figures after 10 December 2023 are included as part of the Private Bus Operator numbers. 20. CDC NSW R4 took over Sydney Metropolitan Bus Service Contracts 4, effective 10 March 2024. The contract area Greater Sydney Bus Contract 4 (GSBC004) reflects this and CDC NSW R4 figures after 10 March 2024 are included as part of the Private Bus Operator numbers. 21. Redbus CDC NSW took over Outer Sydney Metropolitan Bus Service Contract 7, effective 6 July 2024. The contract area Outer Metro Bus Services Contract 7 (OMBSC007) reflects this and Redbus CDC NSW figures after 6 July 2024 are included as part of the Private Bus Operator numbers. 22. Busways OMR6 took over Outer Sydney Metropolitan Bus Service Contract 6, effective 28 July 2024. The contract area Outer Metro Bus Services Contract 6 (OMBSC006) reflects this and Busways OMR6 figures after 28 July 2024 are included as part of the Private Bus Operator numbers. You can find the bus contract boundaries in shapefile format in the [Metro / Outer Metro Bus Contract boundaries](https://opendata.transport.nsw.gov.au/dataset/metro-outer-metro-bus-contract-boundaries) dataset8last year
- Static timetables, stop locations, and route shape information in General Transit Feed Specification (GTFS) format for all operators, including regional, trackwork and transport routes not available in realtime feeds. Returns ZIP file containing CSV files **Please note:** due to the large file size, the API explorer will not work for this resource, ie. 'EXPLORE API' function. To use this dataset please download the zip file using the 'DOWNLOAD' button below or use cURL to get directly. TfNSW GTFS Pathways extension as part of the GTFS Timetables Complete bundle released 2 June 2023.3last year
- Bike sheds and lockers' locations, including latitude and longitude, quantity and asset IDs. Bike sheds and lockers help to keep your bicycle, helmet and associated equipment safe and protected from the weather. Bike sheds are enclosed shared shelters where you can store your bicycle out of the weather, free of charge. They accommodate between 12 and 55 bicycles, depending on requirements at the bike shed location. You don't have to pre-book a space. To gain entry to a bike shed, just link your Opal card and accept the Bike shed terms and conditions. Please note, spaces cannot be guaranteed inside a shed as they are provided on a first in first served basis Bike lockers are individual, lockable spaces to help keep your bike and associated equipment protected from weather, theft and vandalism. There are over 830 bike lockers at 110 locations, so it’s as simple as selecting your location and rental period and enjoying your exclusive locker access. The Bike sheds and lockers website provides you with additional information. This dataset is an excel version of the data that is available on the website. [https://bikelocker.transport.nsw.gov.au/](https://bikelocker.transport.nsw.gov.au/)1last year
- These datasets contain the total number of Sanction transactions and statuses. The data includes: * The count (number) of Active Licence Suspension and Cancellations at the end of each month for a given year. Data will be updated to include the backdated transactions in the previous 2 months. Interactive analytics from 1 July 2022 is available on Registration and Licensing Statistics Portal [https://www.transport.nsw.gov.au/registration-and-licensing-statistics-p...](https://www.transport.nsw.gov.au/registration-and-licensing-statistics-portal) Information prior to 1 July 2022 is available on Webstats [https://roads-waterways.transport.nsw.gov.au/cgi-bin/index.cgi?action=st...](https://roads-waterways.transport.nsw.gov.au/cgi-bin/index.cgi?action=statstables.default) Disclaimer: Transport for NSW (TfNSW) publishes statistical licensing and registration data to disseminate information and provide transparency for the benefit of the public. TfNSW has taken care to ensure that data published is correct and accurate as possible. The data has been consistently produced and is updated regularly. However, TfNSW does not warrant, represent or guarantee the accuracy, reliability, quality or suitability for any purpose of the information or data published at this website nor accept any responsibility arising in connection with any errors in, or omissions from, the information or data provided. TfNSW does not accept any legal liability for any loss or damage arising directly or indirectly from the use of information or data published at this website. TfNSW recommends that users exercise their own skill, care and judgement with respect to their use of information or data published including by evaluating the relevance of the material on this website for their purpose.3last year
- Bike sheds are enclosed shared shelters where you can store your bicycle out of the weather, free of charge. They accommodate between 20 and 50 bicycles, depending on requirements at the [**bike shed location**](https://appln.transport.nsw.gov.au/bikelockers/faces/jsp/public/findBikeParking.xhtml). You don't have to pre-book a space. To gain entry to a bike shed, just link your Opal card and accept the [**Bike shed terms and conditions**](https://appln.transport.nsw.gov.au/bikelockers/faces/jsp/public/shedConditionsOfUse.xhtml). Please note, spaces cannot be guaranteed inside a shed as they are provided on a first in first served basis. This dataset captures the Bike Shed usage at the various available locations from February 2020 to January 2021 and from January 2023 to Jul 2024 The [**Bike sheds and lockers**](https://appln.transport.nsw.gov.au/bikelockers/faces/jsp/public/home.xhtml) website provides you with additional information.1last year
- This dataset provides the Sydney Metropolitan and Outer Metropolitan Bus Service Contract on time running results from 2010 onward. Until June 2017, Transport for NSW monitored on-time running through monthly surveys conducted over a sample period at the start of the trip. As of July 2017, PTIPS replaced manual surveys as the source of information for these on-time running results. The definition of "on time" is provided in the bus contracts which can be found here: [https://www.transport.nsw.gov.au/operations/buses-and-coaches/bus-contracts](https://www.transport.nsw.gov.au/operations/buses-and-coaches/bus-contracts)3last year
- This API provides information about the operators which are contracted to Transport for NSW. It provides the route and service by Operator. This data is also considered a master (reference) list of transport routes and lines. The data is based on the Transport for NSW Contract Management Route Services and includes route lookup, operator contact details, operator Twitter handles, colours and icons.3last year
- Transport for NSW provides projections of workforce at the small area (Travel Zone or TZ) level for NSW. The latest version is Travel Zone Projections 2024 (TZP24), released in January 2025. TZP24 replaces the previously published TZP22. The projections are developed to support a strategic view of NSW and are aligned with the [NSW Government Common Planning Assumptions]( https://www.treasury.nsw.gov.au/information-public-entities/nsw-common-planning-assumptions). TZP24 Workforce Projections cover persons who reside in Occupied Private Dwellings, aged 15 years and over, and are presented by their usual place of residence. The following Workforce variables are presented in TZP24: * Employed People, 15 years and over * Unemployed People, 15 years and over * People not in the workforce, 15 years and over The projections in this release, TZP24, are presented annually from 2021 to 2031 and 5-yearly from 2031 to 2066, and are in TZ21 geography. Please note, TZP24 is based on best available data as at early 2024 and the projections incorporate results of the National Census conducted by the ABS in August 2021. **Key Data Inputs used:** * TZP24 Population and Dwellings projections * Workforce participation rates - NSW Treasury * Historical labour force data - ABS Labour Force Survey For a summary of the TZP24 Projections method please refer to the [TZP24 Factsheet](https://opendata.transport.nsw.gov.au/data/dataset/workforce-projections/resource/1485dbb7-d292-4290-9fea-57f279652726). For more detail on the projection process please refer to the [TZP24 Technical Guide](https://opendata.transport.nsw.gov.au/data/dataset/workforce-projections/resource/a1922724-4b6f-4c6c-80f6-26eca7ae530c). Additional land use information for [population](https://opendata.transport.nsw.gov.au/data/dataset/population-projections) and [employment]( https://opendata.transport.nsw.gov.au/data/dataset/employment-projections) as well as [Travel Zone 2021]( https://opendata.transport.nsw.gov.au/data/dataset/travel-zones-2021) boundaries for NSW (TZ21) and concordance files are also available for download on the Open Data Hub. A visualisation of the workforce projections is available on the [Transport for NSW Website](https://www.transport.nsw.gov.au/data-and-research/reference-information/travel-zone-projections-2024). **Cautions** The TZP24 dataset represents one view of the future aligned with the NSW Government Common Planning Assumptions population and employment projections. The projections are not based on specific assumptions about future new transport infrastructure, but do take into account known land-use developments underway or planned, and strategic plans. * TZP24 is a strategic state-wide dataset and caution should be exercised when considering results at detailed breakdowns. * The TZP24 outputs represent a point in time set of projections (as at early 2024). * The projections are not government targets. * Travel Zone (TZ) level outputs are projections only and should be used as a guide. As with all small area data, aggregating of travel zone projections to higher geographies leads to more robust results. * As a general rule, TZ-level projections are illustrative of a possible future only. * More specific advice about data reliability for the specific variables projected is provided in the “Read Me” page of the Excel format summary spreadsheets on the TfNSW Open Data Hub. * Caution is advised when comparing TZP24 with the previous set of projections (TZP22) due to addition of new data sources for the most recent years, and adjustments to methodology. **Further cautions and notes can be found in the TZP24 Technical Guide**13last year
- This dataset includes spatial datasets of Maritime NSW Public Moorings locations in the following formats: - a searchable api - csv - geoJSON - JSON - kml - shapefile An interactive map shows the locations of courtesy and emergency moorings owned and maintained by Transport for NSW Maritime.8last year
- RMS has permanent and temporary roadside collection devices which continuously collect traffic information data. Through the Traffic Volume Counts API, traffic count data from 2006 is available. There are four datasets (tables) that can be queried: **Traffic Collection Station Reference**- This table provides a general description of the traffic collection station e.g. Geospatial coordinates, road name, suburb, postcode, device type, road number, road type including the data quality rating. **Annual Average Traffic Count Summary** - This table provides the general description of traffic station, traffic direction, date of recording and the quality of data. **Permanent Hourly Traffic Counts**- This table provides hourly traffic count for each permanent station post 2006 at a daily level. **Sample Hourly Traffic Counts** - This table provides hourly traffic count for each sample station post 2006 at a daily level. The Traffic Volume Viewer map provides average road traffic volumes for a selection of permanent and sample roadside collection device stations at key locations across NSW. Please visit [https://www.rms.nsw.gov.au/about/corporate-publications/statistics/traff...](https://www.rms.nsw.gov.au/about/corporate-publications/statistics/traffic-volumes/aadt-map/index.html)6last year
- These datasets contain the total number of photo card transactions and statuses. The data includes: * The count (number) of Photo Card transactions per month for a given year. * The count of active Photo Cards at the end of each month for a given year. Data will be updated to include the backdated transactions in the previous 2 months. Interactive analytics from 1 July 2022 is available on Registration and Licensing Statistics Portal [https://www.transport.nsw.gov.au/registration-and-licensing-statistics-p...](https://www.transport.nsw.gov.au/registration-and-licensing-statistics-portal) Information prior to 1 July 2022 is available on Webstats [https://roads-waterways.transport.nsw.gov.au/cgi-bin/index.cgi?action=st...](https://roads-waterways.transport.nsw.gov.au/cgi-bin/index.cgi?action=statstables.default) Disclaimer: Transport for NSW (TfNSW) publishes statistical licensing and registration data to disseminate information and provide transparency for the benefit of the public. TfNSW has taken care to ensure that data published is correct and accurate as possible. The data has been consistently produced and is updated regularly. However, TfNSW does not warrant, represent or guarantee the accuracy, reliability, quality or suitability for any purpose of the information or data published at this website nor accept any responsibility arising in connection with any errors in, or omissions from, the information or data provided. TfNSW does not accept any legal liability for any loss or damage arising directly or indirectly from the use of information or data published at this website. TfNSW recommends that users exercise their own skill, care and judgement with respect to their use of information or data published including by evaluating the relevance of the material on this website for their purpose.6last year
- Transport for NSW provides projections of population and dwellings at the small area (Travel Zone or TZ) level for NSW. The latest version is Travel Zone Projections 2024 (TZP24), released in January 2025. TZP24 replaces the previously published TZP22. The projections are developed to support a strategic view of NSW and are aligned with the [NSW Government Common Planning Assumptions](https://www.treasury.nsw.gov.au/information-public-entities/nsw-common-planning-assumptions). _The TZP24 Population & Dwellings Projections dataset covers the following variables:_ * Estimated Resident Population * Structural Private Dwellings (Regional NSW only) * Population in Occupied Private Dwellings, by 5-year Age categories & by Sex * Population in Non-Private Dwellings The projections in this release, TZP24, are presented annually from 2021 to 2031 and 5-yearly from 2031 to 2066, and are in TZ21 geography. Please note, TZP24 is based on best available data as at early 2024, and the projections incorporate results of the National Census conducted by the ABS in August 2021. **Key Data Inputs used in TZP24:** * [2024 NSW Population Projections](https://www.planning.nsw.gov.au/data-and-insights/population-projections) – NSW Department of Planning, Housing & Infrastructure * [2021 Census data](https://www.abs.gov.au/) - Australian Bureau of Statistics (including dwellings by occupancy, total dwellings by Mesh Block, household sizes, private dwellings by occupancy, population age and gender, persons by place of usual residence) For a summary of the TZP24 projection method please refer to the [TZP24 Factsheet](https://opendata.transport.nsw.gov.au/data/dataset/population-projections/resource/cadd7bb9-da0f-4409-80ea-db0eb4603b8e). For more detail on the projection process please refer to the [TZP24 Technical Guide](https://opendata.transport.nsw.gov.au/data/dataset/population-projections/resource/cb7f1454-dad7-49f1-97b6-679780a1ffa2). Additional land use information for [workforce]( https://opendata.transport.nsw.gov.au/data/dataset/workforce-projections) and [employment]( https://opendata.transport.nsw.gov.au/data/dataset/employment-projections) as well as [Travel Zone 2021]( https://opendata.transport.nsw.gov.au/data/dataset/travel-zones-2021) boundaries for NSW (TZ21) and concordance files are also available for download on the Open Data Hub. Visualisations of the population projections are available on the Transport for NSW Website under [Data and research/Reference Information](https://www.transport.nsw.gov.au/data-and-research/reference-information). **Cautions** The TZP24 dataset represents one view of the future aligned with the NSW Government Common Planning Assumptions and population and employment projections. The projections are not based on specific assumptions about future new transport infrastructure but do take into account known land-use developments underway or planned, and strategic plans. * TZP24 is a strategic state-wide dataset and caution should be exercised when considering results at detailed breakdowns. * The TZP24 outputs represent a point in time set of projections (as at early 2024). * The projections are not government targets. * Travel Zone (TZ) level outputs are projections only and should be used as a guide. As with all small area data, aggregating of travel zone projections to higher geographies leads to more robust results. * As a general rule, TZ-level projections are illustrative of a possible future only. * More specific advice about data reliability for the specific variables projected is provided in the “Read Me” page of the Excel format summary spreadsheets on the TfNSW Open Data Hub. * Caution is advised when comparing TZP24 with the previous set of projections (TZP22) due to addition of new data sources for the most recent years, and adjustments to methodology. **Further cautions and notes can be found in the TZP24 Technical Guide** **Important note:** The Department of Planning, Housing & Infrastructure (DPHI) published the [2024 NSW Population Projections](https://www.planning.nsw.gov.au/data-and-insights/population-projections/explore-the-data) in November 2024. As per DPHI’s published projections, the following variables are excluded from the published TZP24 Population and Dwellings Projections: * Structural Private Dwellings for Travel Zones in 43 councils across Greater Sydney, Illawarra-Shoalhaven, Central Coast, Lower Hunter and Greater Newcastle * Occupied Private Dwellings for Travel Zones in NSW. Furthermore, in TZP24, the Structural Private Dwellings variable aligns with the 2024 Implied Dwelling projections while the Occupied Private Dwellings variable aligns with the 2024 Households projections at SA2 level prepared by DPHI. The above variables are available upon request by contacting **model.selection@transport.nsw.gov.au** - Attention Place Forecasting.16last year
- This dataset contains a consolidated view of Official Utilisation figures across all transport modes (train, metro, bus, ferry and light rail). Opal daily tap-on/tap-off data is aggregated to a total monthly figure representing the estimated number of trips across all transport modes. Starting July 1, 2024, the methodology for calculating trip numbers for individual lines and operators will change to more accurately reflect the services our passengers use within the transport network. This new approach will apply to trains, metros, light rail, and ferries, and will soon be extended to buses. Aggregations between line, agency, and mode levels will no longer be valid, as a passenger may use multiple lines on a single trip. Trip numbers at the line, operator, or mode level should be used as reported, without further combinations. The dataset includes reports based on both the new and old methodologies, with a transition to the new method taking place over the coming months. As a result of this change, caution should be exercised when analysing longer trends that utilise both datasets. More information on NRT ROAM can be accessed [here](http://opendata.transport.nsw.gov.au/dataset/roam-rail-opal-assignment-model)5last year
- last year
- This dataset contains Official Train and Metro Utilisation figures. Opal tap-on/tap-off data (representing an individual entering & exiting a station), is allocated to a line and aggregated to a monthly figure for the estimated number of trips. Starting July 1, 2024, the methodology for calculating trip numbers for individual lines and operators will change to more accurately reflect the services our passengers use within the transport network. This new approach will apply to trains, metros, light rail, and ferries, and will soon be extended to buses. Aggregations between line, agency, and mode levels will no longer be valid, as a passenger may use multiple lines on a single trip. Trip numbers at the line, operator, or mode level should be used as reported, without further combinations. The dataset includes reports based on both the new and old methodologies, with a transition to the new method taking place over the coming months. As a result of this change, caution should be exercised when analysing longer trends that utilise both datasets. More information on NRT ROAM can be accessed [here](http://opendata.transport.nsw.gov.au/dataset/roam-rail-opal-assignment-model) Notes: (1) The timetable change on 26 November 2017 results in new line definitions and patronage splits by line for the period 26-30 November and all subsequent months. (2) A more accurate methodology for assigning trips to train line and operator has been applied to patronage from July 2017 onwards resulting in changes a revision to July – November 2017 patronage previously reported. **Caution** 1. School Student travel using concessional Opal cards is included. However this may be underrepresented, due to inconsistent tap-on/tap-off behaviour by students 2. Magnetic Stripe Ticketing (MST – paper tickets) data was also available in July 2016. MST patronage data for July is available [here](http://www.bts.nsw.gov.au/ArticleDocuments/233/Jul-16_MST_patronage_all_modes.xlsx.aspx) 3. Opal data may be subject to minor revision for the two months following upload 4. Data is static at a point in time, and may not match other reports that are real time 5. All non-Opal travel is excluded, for example transport concession entitlement cards, integrated ticketing for major events, and fare non-compliance 6. An Opal Trip is defined as a tap-on/tap-off pair (including where only a single tap-on or tap-off is recorded) 7. The timetable change on 26 November 2017 results in new line definitions with new patronage splits. This change makes patronage comparisons by line inconsistent before and after this date. The splits by line will be continually updated each month to adjust for changes in commuter behaviour in response to the change in timetable. 8. Historical data may change as new Opal data and patronage line splits becomes available for reporting. 9. Station Link, a high frequency bus service temporarily replaces train services for the closure of Macquarie University, Macquarie Park and North Ryde train stations while upgrading to Sydney Metro Northwest standards. Effective from 30th September 2018 for approximately 7 months. 10. Sydney Metro North West commenced operations May 2019. 11. Sydney Metro North West & Bankstown Line, Chatswood to Sydenham commenced operations 19 August 2024.10last year
- This dataset provides monthly measures for on-time running, service cancellations, customer complaints, and customer experience metrics across all Greater Sydney Bus Contract (GSBC) and Outer Sydney Metropolitan Bus Contract (OSMBSC) contracts. __Data Description :__ *__Monthly % Bus Service Cancellations :__ Percentage of timetabled services that were cancelled at the First Transit Stop of a trip.* *__Monthly % Bus Service Untracked Trips :__ Percentage of timetabled services that were not tracked in real time at the First Transit Stop of a trip.* *__Monthly Bus Driver Vacancies :__ Number of driver vacancies.* *__Monthly Bus Related Complaints :__ The level of bus related customer complaints per 100,000 boardings.*1last year
- The Sydney light rail network is a light rail system serving the Australian city of Sydney. The network currently consists of three passenger routes, the L1 Dulwich Hill, L2 Randwick and L3 Kingsford lines. This dataset provides WCAG 2.0 compliant wayfinding maps for 42 Sydney light rail stops. Each map displays the local area map and the stop map providing information such as transport connections, customer assistance and tickets. **Current Sydney light rail network** 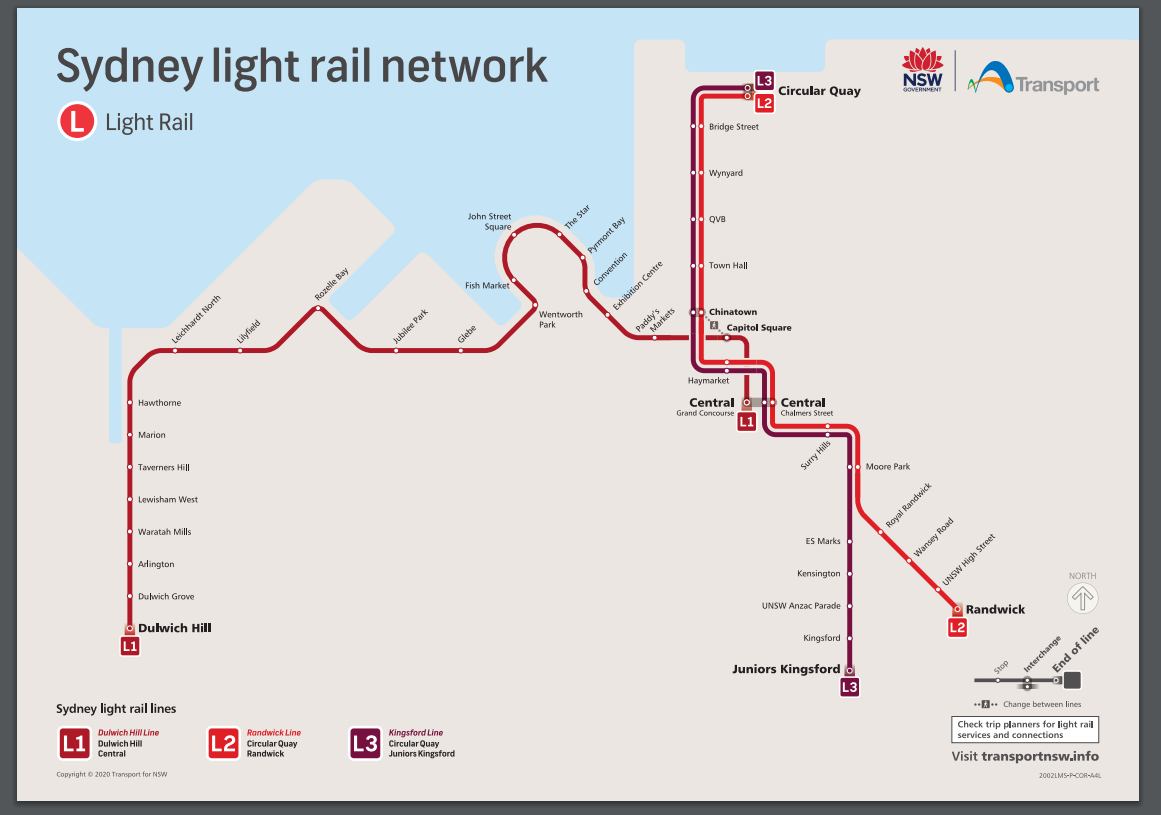131last year
- This dataset contains Official Light Rail Utilisation figures. Opal tap-on/tap-off data (representing an individual entering and exiting a Light Rail station), is aggregated to a total monthly figure representing the estimated number of trips. Starting July 1, 2024, the methodology for calculating trip numbers for individual lines and operators will change to more accurately reflect the services our passengers use within the transport network. This new approach will apply to trains, metros, light rail, and ferries, and will soon be extended to buses. Aggregations between line, agency, and mode levels will no longer be valid, as a passenger may use multiple lines on a single trip. Trip numbers at the line, operator, or mode level should be used as reported, without further combinations. The dataset includes reports based on both the new and old methodologies, with a transition to the new method taking place over the coming months. As a result of this change, caution should be exercised when analysing longer trends that utilise both datasets. More information on NRT ROAM can be accessed [here](http://opendata.transport.nsw.gov.au/dataset/roam-rail-opal-assignment-model) **Caution** 1. School Student travel using concessional Opal cards is included. However this may be underrepresented, due to inconsistent tap-on/tap-off behaviour by students at light rail stations 2. Magnetic Stripe Ticketing (MST – paper tickets) data was also available in July 2016. MST patronage data for July is available [here](http://www.bts.nsw.gov.au/ArticleDocuments/233/Jul-16_MST_patronage_all_modes.xlsx.aspx) 3. Opal data may be subject to minor revision for the two months following upload 4. Data is static at a point in time, and may not match other reports that are real time 5. All non-Opal travel is excluded, for example transport concession entitlement cards, integrated ticketing for major events, and fare non-compliance 6. An Opal Trip is defined as a tap-on/tap-off pair (including where only a single tap-on or tap-off is recorded) 7. A significant portion of the Light Rail line was closed during the months of January 2017 and 2018, resulting in lower number of trips in both months **Please note:** the data includes Newcastle Light Rail6last year
- These datasets contain the total number of Licensing Transactions and Statuses. The data includes: * The count (number) of Licence Upgrade and Downgrade, Interstate Licence Conversion, Licence Replacement, Conditional Licence, Licence Renewal, Licence Holders, Active Licences, Licence Issue. Data will be updated to include the backdated transactions in the previous 2 months. Interactive analytics from 1 July 2022 is available on Registration and Licensing Statistics Portal [https://www.transport.nsw.gov.au/registration-and-licensing-statistics-p...](https://www.transport.nsw.gov.au/registration-and-licensing-statistics-portal) Information prior to 1 July 2022 is available on Webstats [https://roads-waterways.transport.nsw.gov.au/cgi-bin/index.cgi?action=st...](https://roads-waterways.transport.nsw.gov.au/cgi-bin/index.cgi?action=statstables.default) Disclaimer: Transport for NSW (TfNSW) publishes statistical licensing and registration data to disseminate information and provide transparency for the benefit of the public. TfNSW has taken care to ensure that data published is correct and accurate as possible. The data has been consistently produced and is updated regularly. However, TfNSW does not warrant, represent or guarantee the accuracy, reliability, quality or suitability for any purpose of the information or data published at this website nor accept any responsibility arising in connection with any errors in, or omissions from, the information or data provided. TfNSW does not accept any legal liability for any loss or damage arising directly or indirectly from the use of information or data published at this website. TfNSW recommends that users exercise their own skill, care and judgement with respect to their use of information or data published including by evaluating the relevance of the material on this website for their purpose.12last year
- This dataset contains details for NSW TrainLink sales agents, including address, telephone number, opening hours and latitude/longitude. This data is also available at the following link: [https://transportnsw.info/sales-agents#/](https://transportnsw.info/sales-agents#/)1last year
- Transport for NSW provides projections of employment at the small area (Travel Zone or TZ) level for NSW. The latest version is Travel Zone Projections 2024 (TZP24), released in January 2025. TZP24 replaces the previously published TZP22. The projections are developed to support a strategic view of NSW and are aligned with the [NSW Government Common Planning Assumptions](https://www.treasury.nsw.gov.au/information-public-entities/nsw-common-planning-assumptions). TZP24 Employment Projections are for employed persons by place of work. They are provided by Industry using two breakdowns: * 33 industry categories (equivalent to the ABS 1-digit Australia and New Zealand Standard Industrial Classification (ANZSIC) codes with the exception of Manufacturing which is at 2-digit level). * 4 Broad Industry Categories (groupings of the above). The projections in this release, TZP24, are presented annually from 2021 to 2031 and 5-yearly from 2031 to 2066, and are in TZ21 geography. Please note, TZP24 is based on best available data as at early 2024, and the projections incorporate results of the National Census conducted by the ABS in August 2021. **Key Data Inputs used:** * TZP24 Workforce Projections * Census 2021 Place of Work by Destination Zone - ABS * NSW Intergenerational Report - NSW Treasury * SA4 Employment by industry projections - Victoria University * Future Employment Development Database (FEDD) - a custom dataset compiled by TfNSW between August 2023 and February 2024, that presents the number of jobs expected from major projects based on publicly available documents. For a summary of the TZP24 Projections method please refer to the [TZP24 Factsheet]( https://opendata.transport.nsw.gov.au/data/dataset/employment-projections/resource/cabdece8-98a2-4004-b2bc-30e4d153a2da). For more detail on the projection process please refer to the [TZP24 Technical Guide]( https://opendata.transport.nsw.gov.au/data/dataset/employment-projections/resource/ca2fcd4d-fcaf-412a-b761-e5c86af6f570). Additional land use information for [population](https://opendata.transport.nsw.gov.au/data/dataset/population-projections) and [workforce]( https://opendata.transport.nsw.gov.au/data/dataset/workforce-projections) as well as [Travel Zone 2021]( https://opendata.transport.nsw.gov.au/data/dataset/travel-zones-2021) boundaries for NSW (TZ21) and concordance files are also available for download on the Open Data Hub. Visualisations of the employment projections are available on the [Transport for NSW Website](https://www.transport.nsw.gov.au/data-and-research/reference-information). **Cautions** The TZP24 dataset represents one view of the future aligned with the NSW Government Common Planning Assumptions for population and employment projections. The projections are not based on specific assumptions about future new transport infrastructure, but do take into account known land-use developments underway or planned, and strategic plans. * TZP24 is a strategic state-wide dataset and caution should be exercised when considering results at detailed breakdowns. * The TZP24 outputs represent a point in time set of projections (as at early -2024). * The projections are not government targets. * Travel Zone (TZ) level outputs are projections only and should be used as a guide. As with all small area data, aggregating of travel zone projections to higher geographies leads to more robust results. * As a general rule, TZ-level projections are illustrative of a possible future only. * More specific advice about data reliability for the specific variables projected is provided in the “Read Me” page of the Excel format summary spreadsheets on the TfNSW Open Data Hub. * Caution is advised when comparing TZP24 with the previous set of projections (TZP22) due to addition of new data sources for the most recent years, and adjustments to methodology. **Further cautions and notes can be found in the TZP24 Technical Guide.**16last year
- These data sets contain freight forecast, performance and other statistics. The data includes: * Strategic Freight Forecasts - NSW freight commodity demand volume forecasts for the 40 year period between 2016 to 2056 * Freight performance dashboard – Strategic Targets from NSW Freight and Ports Plan 2018-2023 including + Use of rail freight + Road safety + Rail freight access + Rail freight capability + Port Botany Efficiency Detailed information for drivers and rationale used to produce NSW freight commodity demand volume forecasts can be found in the [NSW Freight Commodity Demand Forecasts 2016-56 Report](https://www.transport.nsw.gov.au/system/files/media/documents/2018/NSW%20Freight%20Commodity%20Demand%20Forecasts%202016-56%5Baccessible%5D_0.pdf). A visualisation of the Strategic Freight Forecasts is available on the Transport for NSW Website under [Freight data](https://www.transport.nsw.gov.au/data-and-research/freight-data). Additional information on above Strategic Targets is available in the [NSW Freight and Ports Plan 2018-2023](https://www.transport.nsw.gov.au/projects/strategy/nsw-freight-and-ports-plan). Visualisations of the Strategic Targets are available on the Transport for NSW Website under [Freight data](https://www.transport.nsw.gov.au/data-and-research/freight-data).13last year
- This dataset contains Official Ferry Utilisation figures. Opal tap-on/tap-off data (representing an individual entering & exiting a wharf), is allocated to a route and aggregated to a monthly figure for the estimated number of trips. Starting July 1, 2024, the methodology for calculating trip numbers for individual lines and operators will change to more accurately reflect the services our passengers use within the transport network. This new approach will apply to trains, metros, light rail, and ferries, and will soon be extended to buses. Aggregations between line, agency, and mode levels will no longer be valid, as a passenger may use multiple lines on a single trip. Trip numbers at the line, operator, or mode level should be used as reported, without further combinations. The dataset includes reports based on both the new and old methodologies, with a transition to the new method taking place over the coming months. As a result of this change, caution should be exercised when analysing longer trends that utilise both datasets. More information on NRT ROAM can be accessed [here](http://opendata.transport.nsw.gov.au/dataset/roam-rail-opal-assignment-model) **Caution** 1. School Student travel using concessional Opal cards is included. However this may be underrepresented, due to inconsistent tap-on/tap-off behaviour by students 2. Magnetic Stripe Ticketing (MST – paper tickets) data was also available in July 2016. MST patronage data for July is available here: [http://www.bts.nsw.gov.au/ArticleDocuments/233/Jul-16\_MST\_patronage\_all\_...](http://www.bts.nsw.gov.au/ArticleDocuments/233/Jul-16_MST_patronage_all_modes.xlsx.aspx) 3. Opal data may be subject to minor revision for the two months following upload 4. Data is static at a point in time, and may not match other reports that are real time 5. All non-Opal travel is excluded, for example transport concession entitlement cards, integrated ticketing for major events, and fare non-compliance 6. An Opal Trip is defined as a tap-on/tap-off pair (including where only a single tap-on or tap-off is recorded) 7. Contactless Travel Payment (CTP) trial started on 6 July 2017 for the F1 Manly/Circular Quay ferry service 8. The timetable change on 26 November 2017 results in new route definitions with new patronage splits. This change makes patronage comparisons by route inconsistent before and after this date. The splits by route will be continually updated each month to adjust for changes in commuter behaviour in response to the change in timetable 9. Historical data may change as new Opal data and patronage route splits becomes available for reporting 10. Manly Fast Ferry joined the Opal Network 1 October 2023. Their patronage data is included as part of F1 Manly data from October 2023.5last year
- Static timetables and stop locations in TransXChange (TXC) format for all operators, including regional and private operators and routes not currently available in realtime feeds. TransXChange is an implementation of the Transmodel open standard for public transport information. Further information is available at [www.transxchange.org.uk](http://www.transxchange.org.uk) Returns ZIP file containing XML files. **Please note:** due to the large file size, the API explorer will not work for this resource, ie. 'EXPLORE API' function. To use this dataset please download the zip file using the 'DOWNLOAD' button below or use cURL to get directly.2last year
- This dataset provides WCAG 2.0 compliant wayfinding maps for 48 Sydney train stations and 13 Metro Stations. Each map displays entrances, lift locations, transport mode interchanges including bus ranks, taxi ranks and pick-up areas.97last year
- These datasets contain the total number of Mobility Parking Scheme transactions and statuses. The data includes: * The count (number) of Mobility Parking Scheme transactions per month for a given year. * The count of active Mobility Parking Permits at the end of each month for a given year. Data will be updated to include the backdated transactions in the previous 2 months. Interactive analytics from 1 July 2022 is available on Registration and Licensing Statistics Portal [https://www.transport.nsw.gov.au/registration-and-licensing-statistics-p...](https://www.transport.nsw.gov.au/registration-and-licensing-statistics-portal) Information prior to 1 July 2022 is available on Webstats [https://roads-waterways.transport.nsw.gov.au/cgi-bin/index.cgi?action=st...](https://roads-waterways.transport.nsw.gov.au/cgi-bin/index.cgi?action=statstables.default) Disclaimer: Transport for NSW (TfNSW) publishes statistical licensing and registration data to disseminate information and provide transparency for the benefit of the public. TfNSW has taken care to ensure that data published is correct and accurate as possible. The data has been consistently produced and is updated regularly. However, TfNSW does not warrant, represent or guarantee the accuracy, reliability, quality or suitability for any purpose of the information or data published at this website nor accept any responsibility arising in connection with any errors in, or omissions from, the information or data provided. TfNSW does not accept any legal liability for any loss or damage arising directly or indirectly from the use of information or data published at this website. TfNSW recommends that users exercise their own skill, care and judgement with respect to their use of information or data published including by evaluating the relevance of the material on this website for their purpose.6last year
- This dataset shows the number of registered boats by postcode in NSW and the number of active boat licences by postcode in NSW. Maritime NSW deals with recreational boating so the dataset includes registrations for recreational vessels (RV) as well as personal watercraft recreational (PWCR) and the boating licence counts are for the same general boating licence - recreational vessel and general PWC boating licence. The data will be updated on a monthly basis.3last year
- Speed zones are set to enable drivers travelling at a speed limit to safely respond to potential risks in the road environment. This dataset contains data for NSW speed zones that are categorised as: * Ordinary Permanent * Shared * High Pedestrian * School * Variable * Local Traffic * Truck & bus * Wet Weather * School Bus * Toll Plaza * Default11last year
- The counts of train and metro station entries and exits are derived from samples representing 'typical days' and monthly data. Please note that the dataset is updated according to the NRT model, ‘Typical day’ data only available from 2016 to 2023. * The August update includes information on the new Metro Stations ( Sydney metro Northwest stage 2) and utilises a new data source.. As of July 1, 2024, Transport will transition to a new Opal Allocation Model. The existing Rail Opal Allocation Model (ROAM) data will be replaced by the new Near Real Time (NRT) ROAM. More information about NRT ROAM can be accessed [here](http://opendata.transport.nsw.gov.au/dataset/roam-rail-opal-assignment-model) Note: * Sydney Metro North West stage 2 commenced operations Aug 2024. * Sydney Metro North West stage 1 commenced operations May 2019. * Sydney Metro North West & Bankstown Line, Chatswood to Sydenham commenced operations 19 August 2024.4last year
- Operator contact details and location facilities for train stations, ferry wharves and bus interchanges. Gateway API is provided for legacy applications, this data is no longer updated and API will be retired in the the near future. To use these resources in your application please follow the CKAN api instructions in the resource description.3last year
- These datasets contain the total number of Registration transactions and Statuses. The data includes: * The count (number) of Registered Vehicle Transactions per month for a given year. * The count of Registered Vehicles at the end of each month for a given year. * The count of Vehicle Usage at the end of each month for a given year. * The count Heavy Vehicle Usage at the end of each month for a given year. * The age of Registered Vehicles at the end of each month for a given year. Data will be updated to include the backdated transactions in the previous 2 months. Interactive analytics from 1 July 2022 is available on Registration and Licensing Statistics Portal [https://www.transport.nsw.gov.au/registration-and-licensing-statistics-p...](https://www.transport.nsw.gov.au/registration-and-licensing-statistics-portal) Information prior to 1 July 2022 is available on Webstats [https://roads-waterways.transport.nsw.gov.au/cgi-bin/index.cgi?action=st...](https://roads-waterways.transport.nsw.gov.au/cgi-bin/index.cgi?action=statstables.default) Disclaimer: Transport for NSW (TfNSW) publishes statistical licensing and registration data to disseminate information and provide transparency for the benefit of the public. TfNSW has taken care to ensure that data published is correct and accurate as possible. The data has been consistently produced and is updated regularly. However, TfNSW does not warrant, represent or guarantee the accuracy, reliability, quality or suitability for any purpose of the information or data published at this website nor accept any responsibility arising in connection with any errors in, or omissions from, the information or data provided. TfNSW does not accept any legal liability for any loss or damage arising directly or indirectly from the use of information or data published at this website. TfNSW recommends that users exercise their own skill, care and judgement with respect to their use of information or data published including by evaluating the relevance of the material on this website for their purpose.15last year
- This dataset provides **Bus Guides** for 13 Metro Stations along the Sydney Metro North West Line, including 8 new metro stations along the Chatswood to Sydenham extension due to commence August 2024. Each guide displays a table with all the Bus routes including the destination description and stand section and a Bus Map.39last year
- Shapefile for the TfNSW bicycle network maintained by Roads and Maritime Services. This dataset is automatically updated monthly when changes occur.3last year
- Travel Zones (TZs) are the spatial unit of geography for Transport for NSW (TfNSW). The TZ spatial layer is applied to data sources used by TfNSW for transport modelling and analysis, including the Travel Zone Projections and key transport models such as the Strategic Travel Model (STM). The [Australian Statistical Geography Standard (ASGS) Edition 3](https://www.abs.gov.au/statistics/standards/australian-statistical-geography-standard-asgs-edition-3/latest-release) boundaries provided by the Australian Bureau of Statistics (ABS) form the foundation of the Travel Zone geography. Generally, a TZ is an aggregation of whole ABS Mesh Blocks. The ASGS are based on population counts, whereas TZ boundaries are defined using population, employment, housing and transport infrastructure, with consideration for planned future changes in land use. Some of the State’s greenfield growth areas have deviated from using whole Mesh Blocks. Instead, Department of Planning, Housing and Infrastructure (DPHI) growth area precincts have been used to create more functional TZs in those areas (for example, the Aerotropolis). TZs are designed to have standardised trip generation levels across all zones. This causes zones to be different sizes across NSW. As with many other spatial boundaries, TZs tend to be small in areas with high land-use densities and larger in areas of lower density. As areas and transport infrastructure change over time, TfNSW creates new Travel Zone geography in line with each ABS Census of Population and Housing, the latest being 2021. Below you can download spatial files of the Travel Zone 2021 (TZ21) geography, the TZ21 fact sheet, as well as concordance tables for various geographies to TZ21 and vice versa.7last year
- Eurobodalla is on the New South Wales south coast and enjoys a reputation as a water and nature lovers' paradise. Cycling is one of the true pleasures that the Eurobodalla Nature Coast offers. Eurobodalla Council has four kilometres of on-road cycling amenity, with links to the existing shared pathway network. The section of Beach Road between the Batehaven shops to Caseys Beach includes dedicated bicycle lanes, defined by line marking applied along the sealed road shoulders. Read more about the initiative via [Safer cycling on Beach Road.](https://www.esc.nsw.gov.au/home/news-and-events/media-releases/media-releases/safer-cycling-on-beach-road) Visit [Eurobodalla Cycle Routes](https://eurobug.weebly.com/routes.html) to find out more information about suggested routes for cycling.3last year
- Released under formal Government Information Public Access (GIPA) Application to Department of Finance, Services and Innovation (DFSI) - FA#96 15-16 1. The number of penalty notices issued in 2015 for in each of the bus contract regions and State Transit Authority Buses 2. The number of penalty notices issued in 2014 for in each of the bus contract regions and State Transit Authority Buses. 3. The number of penalty notices issued in 2013 for in each of the bus contract regions and State Transit Authority Buses 4. The number of penalty notices issued in 2012 for in each of the bus contract regions and State Transit Authority Buses1last year
- This dataset includes pop-up cycleways in key commuter areas across the city to promote walking and bike riding. The pop-up cycleways is part of a set of initiatives developed across the Sydney region to provide people more options to safely walk, bike ride and commute to work in 2020. The data sets provided are for the pop-up cycleways only. More cycleway (bike paths) data can be referenced from the Cycleway Finder [https://www.rms.nsw.gov.au/maps/cycleway\_finder](https://www.rms.nsw.gov.au/maps/cycleway_finder) and [Open Street Map](https://www.openstreetmap.org).7last year
- This dataset provides results data from the Fare Compliance Survey Results reports from November 2012 to the latest report (the surveys were not conducted in 2020 due to Covid). The fare compliance survey is conducted twice yearly in May and November, and is designed to measure the incidence of non-compliance and associated revenue loss across the public transport network. A report from each survey is also published on: [https://www.transport.nsw.gov.au/news-and-events/reports-and-publication...](https://www.transport.nsw.gov.au/news-and-events/reports-and-publications/fare-compliance-survey-results).2last year
- Stop time updates for active trips, replacement vehicles, and changed stopping patterns in GTFS-realtime format for Buses, Ferries, Light Rail, Trains, Metro and Regional Bus Services (our regional services are at times referenced as "TCB" - Transport Connected Bus). An up to date list of all TCB services can be found [on the forum](https://opendataforum.transport.nsw.gov.au/t/new-real-time-regional-bus-data-is-now-available/2060).1last year
- The Western Parkland City Digital Equity and Inclusion project shows the localised findings of targeted research aimed at benchmarking digital inclusion across the Western Parkland City. The index scores, depicted through a choropleth map, highlight specific gaps and priorities for improving overall digital inclusion and dimensions of Access, Ability and Affordability across each of the eight participating Council areas. ###__Ability__ Digital Ability is about our skill levels: what we are able do online, and our confidence in doing it. Having limited digital capability in the types of skills and knowledge needed to get online, operate functions and navigate sites with confidence and safety has been referred to the ‘second level’ digital divide. In measuring Digital Ability, the ADII draws upon the Internet Skills Scale (ISS) to focus on six skills domains. The ADII’s Digital Ability score measures the following skills components: * __Basic operational__ (i.e., downloading and opening files, connecting to the internet, and setting passwords) * __Advanced operational__ (i.e., saving to the cloud, determining what is safe to download, customising devices and connections, and adjusting privacy settings (e.g. downloading and opening files, connecting to the internet)) * __Information navigation__ (i.e., searching and navigating, verifying trustworthy information, and managing third party data collection) * __Social__ (i.e., deciding what to share, how, and who with, managing and monitoring contacts, and communicating with others) * __Creative__ (i.e., editing, producing, and posting content, as well as having a broad understanding of the rules that may apply to these activities) * __Smart__ (i.e., connecting, operating, and managing smart devices and IoT technologies) ###__Access__ The Digital Access dimension within the ADII is a measure of several interrelated components of internet usage that include intensity and frequency of use, types of devices, and use of fixed and mobile plans. It is well recognised that the quality of both fixed and mobile connectivity is problematic and underserviced in regional and remote areas – often due to intermittent and unreliable access to the nbn. ###__Affordability__ As connected technologies have developed and more people move online, some gaps in connectivity access have narrowed. However, for many people, particularly in areas with higher concentrations of low-income individuals and households, affordability can present significant barriers to achieving digital equity across the city. This includes being able to afford quality and reliable mobile and fixed broadband plans and the devices needed to connect online. __For additional information click this [link](https://www.digitalinclusionindex.org.au/the-adii/)__ __Source:__ Data is sourced through a collaboration between Smart Places, Cities and Active Transport, Transport for NSW and The Parks, Sydney’s Parkland Councils, an alliance of the eight local government areas that comprise Western Parkland City as part of the Western Parkland City Digital Equity and Inclusion Insights Program. This is currently a one-off release. At this time we do not have plans to update this dataset regularly.4last year
- This dataset details the road closures for Sculpture by the Sea (Thursday 19 October to Sunday 5 November)4last year
- These visualisations feature Opal Trips for all available modes of Public Transport in Sydney CBD. View weekly, monthly and yearly trips from July 2016 onwards.1last year
- last year
- >As Electric Vehicles (EVs) become more prevalent, it's essential that EV charging infrastructure quality and accessibility evolves. Our aim is to enhance the driving experience for EV users throughout New South Wales. To support this initiative, we have released an extensive dataset that includes destination (AC) and fast (DC) EV charging stations currently available in NSW, as well as those scheduled for future development. This dataset provides in-depth details, including the number of chargers, plug types, and power specifications. It can be used by a variety of EV stakeholders to aid planning, policy, design and customer outcomes. Transport for NSW are committed to keeping this information current and will update the dataset every quarter to reflect the latest EV charging developments. Note: Transport for NSW are not responsible for the collection or validation of this information. We recommend checking on the validity of this data and the operational status of the chargers with the charge point operator before relying on it. If you notice an error with this data please write to: ElectricVehicles@Transport.nsw.gov.au4last year
- Static timetables, stop locations, pathways for trains, and route shape information in GTFS format for operators that support realtime. Covers Buses, Ferries, Light Rail, Trains, Metro and Regional Bus Services (our regional services are at times referenced as "TCB" - Transport Connected Bus). An up to date list of all TCB services can be found [on the forum](https://opendataforum.transport.nsw.gov.au/t/new-real-time-regional-bus-data-is-now-available/2060).1last year
- Areas where the generation of wash is prohibited as designated by signs along the waterway.2last year
- Reference tables for TfNSW data. A complete list of agencies and how they are defined in each GTFS feed. **Using Complete GTFS + Real-Time GTFS feeds** The reference tables illustrates agencies that appear in multiple GTFS feeds. If you are using the Complete GTFS bundle in conjuction with the real-time GTFS feeds for each mode then you will need to filter out the Complete GTFS agencies and use the corresponding real-time agencies. **Turn Up and Go/Frequency Services** High Frequency services run to an operational timetable as per the relevant GTFS bundles, however they will adjust to headway in response to operational requirements throughout the day. Therefore we recommend ignoring the delay information passed on in GTFS-R feeds for these routes, and only showing real-time arrival/departure times to customers. **Train Run Numbers** The list of trips in the reference tables represent services that appear in both the Sydney Trains real-time feed and NSW Trains rural and regional real-time feed. If you are using both feeds, TfNSW recommends filtering out these services from the Sydney Trains feed and preferentially using the NSW Trains feed.13last year
- In Sydney, the Blue Mountains, Central Coast, the Hunter and the Illawarra area, fares are calculated based on the distance travelled from tap on to tap off, payment method, the mode of transport, concession eligibility (or free travel) and any Opal benefits such as discounts and capped fares that apply. This dataset provides the Opal Distance for all modes of transport and the Opal Fare Values for each mode of transport. The Opal Fares Business Rules and Information document provides the latest supporting information. For additional information about Opal Fares, Default fares and how Opal Fares are calculated, visit the [Transport Fares and Payments](https://transportnsw.info/tickets-opal/opal/fares-payments) website.2last year
- Indicative locations of coastal bars as described in the Marine Safety Regulation 2016.2last year
- Greater Sydney Metropolitan and Outer Sydney Metropolitan Bus Service Contracts Boundaries. Bus Service Contracts are contracts issued by the Government of New South Wales to metropolitan bus operators and outer metropolitan bus operators to operate their public bus route network. This dataset is the shapefile equivalent to the pdf maps in the [Opal Trips - Bus](https://opendata.transport.nsw.gov.au/dataset/opal-trips-bus) dataset7last year
- Areas where towing of persons is prohibited as designated by signs along the waterway.2last year
- Household Travel Survey (HTS) is the most comprehensive source of personal travel data for the Sydney Greater Metropolitan Area (GMA). This data explores average weekday travel patterns for residents in Sydney GMA. The Household Travel Survey (HTS) collects information on personal travel behaviour. The study area for the survey is the Sydney Greater Metropolitan Area (GMA) which includes Sydney Greater Capital City Statistical Area (GCCSA), parts of Illawarra and Hunter regions. All residents of occupied private dwellings within the Sydney GMA are considered within scope of the survey and are randomly selected to participate. The HTS has been running continuously since 1997/981 and collects data for all days through the year – including during school and public holidays. Typically, approximately 2,000-3,000 households participate in the survey annually. Data is collected on all trips made over a 24-hour period by all members of the participating households. Annual estimates from the HTS are usually produced on a rolling basis using multiple years of pooled data for each reporting year2. All estimates are weighted to the Australian Bureau of Statistics’ Estimated Resident Population, corresponding to the year of collection3. Unless otherwise stated, all reported estimates are for an average weekday. Due to disruptions in data collection resulting from the lockdowns during the COVID-19 pandemic, post-COVID releases of HTS data are based on a lower sample size than previous HTS releases. To ensure integrity of the results and mitigate risk of sampling errors some post-COVID results have been reported differently to previous years. Please see below for more information on changes to HTS post-COVID (2020/21 onwards). 1. Data collection for the HTS was suspended during lock-down periods announced by the NSW Government due to COVID-19. 2. Exceptions apply to the estimates for 2020/21 which are based on a single year of sample as it was decided not to pool the sample with data collected pre-COVID-19. 3. HTS population estimates are also slightly lower than those reported in the ABS census as the survey excludes overseas visitors and those in non-private dwellings. Changes to HTS post-COVID (2020/21 onwards) HTS was suspended from late March 2020 to early October 2020 due to the impact and restrictions of COVID-19, and again from July 2021 to October 2021 following the Delta wave of COVID-19. Consequently, both the 2020/21 and 2021/22 releases are based on a reduced data collection period and smaller samples. Due to the impact of changed travel behaviours resulting from COVID-19 breaking previous trends, HTS releases since 2020/21 have been separated from pre-COVID-19 samples when pooled. As a result, HTS 2020/21 was based on a single wave of data collection which limited the breadth of geography available for release. Subsequent releases are based on pooled post-COVID samples to expand the geographies included with reliable estimates. Disruption to the data collection during, and post-COVID has led to some adjustments being made to the HTS estimates released post-COVID: SA3 level data has not been released for 2020/21 and 2021/22 due to low sample collection. LGA level data for 2021/22 has been released for selected LGAs when robust Relative Standard Error (RSE) for total trips are achieved Mode categories for all geographies are aggregated differently to the pre-COVID categories Purpose categories for some geographies are aggregated differently across 2020/21 and 2021/22. A new data release – for six cities as defined by the Greater Sydney Commission - is included since 2021/22. Please refer to the Data Document for 2022/23 (PDF, 262.54 KB) for further details. RELEASE NOTE The latest release of HTS data is 28 March 2024 . This release includes Region, LGA, SA3 and Six Cities data for 2022/23. This is the first release of SA3 level data from HTS post COVID-19. A revised dataset for HTS 2021/22 data for LGAs and Six Cities has also been included in this release on 28 March 2024. If you have downloaded HTS 2021/22 data by LGA and/or Six Cities from this link prior to 28/03/2024, we advise you replace it with the revised tables. Further revisions may be undertaken on the HTS post-COVID data (since 2020) as we review other datasets to calibrate the travel behaviour post-COVID.19last year
- Parking spaces that are available for service and delivery drivers in Sydney’s CBD (at commercial rates). Returns ZIP file containing GeoJSON and CSV files.5last year
- This dataset contains the major event bus routes to and from Sydney Olympic Park.2last year
- FuelCheck provides historic and real-time information about fuel prices at service stations across NSW and is accessible on any device connected to the internet, including smartphones, tablets, desk top computers and laptops. FuelCheck uses information from cellular, Wi-Fi, and Global Positioning System (GPS) networks to determine your approximate location. FuelCheck enables NSW motorists to * find the cheapest fuel being sold anywhere in NSW * get directions to any service station in NSW * search for fuel by type (E10, Regular, LPG, Electric Vehicle charging etc) or brand * submit a complaint to NSW Fair Trading if the price at the pump doesn’t match what is shown on FuelCheck.2last year
- This dataset contains maps depicting the local area around selected train stations, ferry wharves and lightrail stops. These maps are similar to the ones you might find at a station or stop. Files are in PDF format and grouped by mode.26last year
- This API provides static, real-time and historical data about selected taxi ranks in NSW. Static Feed – Provides details of CCTV installed and secure ranks across NSW, location details (Latitude/Longitude) and hours of operation Real-time Feed – Provides near-real-time taxi/passenger information at a particular taxi rank Historical Feed – Provides historical taxi information of taxis/passengers in 15mins blocks for a specified rank and day2last year
- This dataset includes NSW public school term dates and public holidays. The Department of Education sets the term and school holiday dates for all NSW public schools: [https://education.nsw.gov.au/public-schools/going-to-a-public-school/cal...](https://education.nsw.gov.au/public-schools/going-to-a-public-school/calendars/future-and-past-nsw-term-and-vacation-dates) School development days occur at the beginning of Terms 1, 2 and 3 and the last two days of the school year. Check with your school, as schools may vary some of these dates. NSW public holidays are available here: [https://www.industrialrelations.nsw.gov.au/public-holidays/public-holida...](https://www.industrialrelations.nsw.gov.au/public-holidays/nsw-public-holidays-2013-2015/) The data resources contain historic, current and future dates. [Local Public Holidays in NSW](https://www.industrialrelations.nsw.gov.au/public-holidays/local-public-holidays-in-nsw/) captures additional holiday dates for specific localities.4last year
- This dataset provides the locations of Maritime NSW boat ramps along with details such as the responsible authority, ramp condition, contact details and the available facilities (e.g. toilets, fuel, BBQ facilities, etc.) The dataset is available in the following formats: - a searchable API - csv - GeoJSON - JSON - KML - SHP8last year
- Historical annual number of trips across all modes from financial year 2010/2011 to present.1last year
- Locations of web cameras, including links to the RMS website for viewing of live feeds.2last year
- Travel Zones (TZs) are the spatial unit of geography defined by Transport Performance and Analytics (TPA), a business unit within Transport for NSW (TfNSW). The TZ spatial layer is applied to data sources used by TfNSW for transport modelling and analysis, including the Household Travel Survey and the Census 2016 Journey to Work data. The Australian Bureau of Statistics (ABS) Statistical Area boundaries form the foundation of the TZ. Generally, a TZ is larger than a Statistical Area Level 1 or Mesh Block, both ABS geography definitions. The ABS Statistical Areas are based on population counts whereas TZ boundaries are defined using population, employment, housing and transport infrastructure. TZs are designed to have standardised trip generation levels across all zones. This causes zones to be different sizes across the metropolitan area. As with many other spatial boundaries, TZs tend to be small in areas with high land-use densities and larger in areas of lower density. This dataset now includes a CSV file mapping the Transit Stop Number (TSN) to the Travel Zone (TZ16). It captures the stop name, suburb and coordinates. [Travel Zone Explorer](https://www.transport.nsw.gov.au/data-and-research/reference-information/travel-zone-explorer-visualisation) is an interactive map where you can search for Travel Zones (TZ) and find out the current and future population in occupied private dwellings by age and sex.6last year
- Boat ramps with attributes as displayed on the boat-ramp locator on the RMS website.2last year
- These visualisations feature Opal Trips for all modes of Public Transport by week, month and year. Visualisations for each of the modes show the number of ticketed trips based on operator, line, contract area (where applicable) and card type. An Opal trip describes where an Opal or Contactless card is used to tap-on and tap-off, including where a single tap-on or tap-off is recorded. All other travel is not included. As of 1 July 2024, the methodology for calculating trip numbers for individual Lines and Operators has changed to better reflect the services our passengers use on the transport network. The new approach applies to Train, Metro and Light Rail and will soon be extended to Ferry and Bus. Aggregations between Line, Agency and Mode levels are no longer valid as a passenger may use several lines on a single trip. Trip numbers at Line, Operator or Mode level should be used as provided without further combination. This dataset has reports based on both the new and old methodology with reports progressively moved to the new method in the coming months. Due to the change in method care should be taken when looking at longer trends that utilise both datasets.2last year
- This dataset contains historical GTFS bundles and other older data.17last year
- Twice a year City of Sydney carry out walking count surveys to give us a picture of walking trends across the City of Sydney area. The counts take place at around 100 locations from 6am to midnight in fair weather conditions, on a weekday and a day on the weekend in March and October. The survey locations were selected based on the Liveable Green Network, such as locations of interest or where change is occurring or expected. API provides data in GeoJSON format. For more information visit https://data.cityofsydney.nsw.gov.au/datasets/318c979731e54cb187349d034e1defad_0/explore1last year
- This dataset contains the location of the traffic lights in New South Wales.2last year
- Transport Park&Ride provides up to 18 hours free parking each day. Customers are eligible to free parking by completing a public transport journey by tapping on and off using an accepted Opal card, then use that Opal card when exiting the car park. This dataset includes the co-ordinates of the main car park entries using the main driving entry for each Park&Ride car parks. Selected Park&Ride car parks are available in our realtime [car park API](https://opendata.transport.nsw.gov.au/dataset/car-park-api). **Note: Car park entry co-ordinates were added to the the car park API in July 2024. This dataset will no longer be kept up to date and remains for historical purposes. Please see link above to navigate to Park&Ride car park API.**1last year
- This dataset provides an indicator of historic ferry occupancy for individual ferry services from November 2019. The legacy Ferry Opal Allocation Model (FOAM) will be replaced with a new Near Real Time (NRT) FOAM from the 26 August 2024.2last year
- The raw street parking sign data from Willoughby Council is available for Chatswood CBD only. This is supplied as a Google Maps layer and KMZ file. Photos for each sign are supplied via the embedded links. [https://www.willoughby.nsw.gov.au/Home](https://www.willoughby.nsw.gov.au/Home)2last year
- This data is provided by NSW Government Property Acquisitions. The NSW Government is committed to delivering a fair, equitable, and consistent land acquisition process that seeks to acquire properties by mutual agreement. In the interests of transparency and accountability, the Government collects and publishes key property acquisition data from NSW acquiring agencies, as one means of effectively monitoring the performance of the property acquisition framework. The [Property Acquisitions](https://www.propertyacquisition.nsw.gov.au/about-data) website provides you with detailed information about the data available. To view the data for each reporting period, select Go to Resource.6last year
- Areas of assumed shallow water (depth of less than approximately 2 metres in tidal waters and the shallower water in inland waters at full supply).2last year
- Current vehicle positions in GTFS-realtime format for Buses, Ferries, Light Rail, Trains, Metro and Regional Bus Services (our regional services are at times referenced as "TCB" - Transport Connected Bus). An up to date list of all TCB services can be found [on the forum](https://opendataforum.transport.nsw.gov.au/t/new-real-time-regional-bus-data-is-now-available/2060).1last year
- Transport for NSW wishes to advise a new section of motorway has opened between Yallah and Albion Park. This section of motorway, which is part of the Albion Park bypass, was implemented in mid-May. **The following resources are available:** \* The project's latest community update \* The road alignment aerial overlay (.SHP and PDF files) \* A video produced by the project team which provides useful background information **From 6am Wednesday 26 May 2021 - Traffic changes for Albion Park** \* The motorway between Yallah and Albion Park is open in a temporary arrangement, one lane in each direction with an 80km/hr speed limit. \* The arrangement only provides access to and from Albion Park. \* Motorists travelling to Albion Park, Jamberoo and Moss Vale will temporarily exit to the right at Yallah onto a new section of the motorway, taking them to Terry Street. \* The northbound motorway entry ramp from Albion Park is open, allowing motorist from Albion Park (Terry Street) to travel north on the new motorway. \* A section of the existing Illawarra Highway next to the new motorway has permanently closed to through traffic. A cul-de-sac is being built near Croome Lane. \* Access to residences and businesses on Terry Street near Taylor Road is via Albion Park or the new motorway. \* Motorists travelling south from Dapto, Yallah and Haywards Bay continue to use the existing highway through Albion Park Rail. \* Access to Albion Park, Jamberoo and Moss Vale for these motorists will be via the existing highway and Tongarra Road. \* Access north on the Princes Motorway for Dapto motorists remains unchanged. \* Motorists from Yallah and Haywards Bay travelling north continue to use the existing Princes Highway. \* Motorists travelling from Wollongong continue to use the existing highway to travel south towards Albion Park Rail and Kiama. **From 5am Monday 7 June 2021 (weather permitting) - Traffic lights operational at Oak Flats interchange** \* Traffic lights at the Oak Flats interchange will be operational following a weekend closure of the Oak Flats interchange \* Five sets of traffic lights as per this [video](https://www.youtube.com/watch?v=tcsjNdv5AwU)3last year
- Existing, rideable bicycle routes through the City of Sydney local government area for bicycle commuters. For more information visit [Cycling - City of Sydney](https://www.cityofsydney.nsw.gov.au/cycling).1last year
- The spatial datasets for NSW Bus Routes and includes contracted Greater Sydney Metro and Outer Metro bus routes along with rural and regional contracted bus services. The spatial datasets will be updated daily and include the following formats: - csv - geojson - json - kml - shapefile7last year
- last year
- The Car Park API provides real time and historical occupancy of selected car parks. This API provides the occupancy for Transport Park&Ride car parks. Transport Park&Ride is designed to free-up more spaces at commuter car parks for those who want to travel on public transport. The data feed contains the parking occupancy information by type in real time. The Sydney Metro stations for Tallawong, Bella Vista, Hills Showground, Cherrybrook and Kellyville are reporting real time occupancy levels. It is intended other car park occupancy data will be enabled via this API in the future. Click [here](https://transportnsw.info/travel-info/ways-to-get-around/drive/parking/transport-parkride-car-parks) for more information on Transport Park&Ride.2last year
- Areas of speed restrictions (in knots) as designated by signs along the waterway.2last year
- People often use different modes of transport at various times for a range of reasons, so it is important that we continue to listen to how people in NSW rate their experiences throughout their entire journey. Conducting the ‘Customer Satisfaction Index’ helps us gain insight into the experiences of our transport users, which helps us focus our efforts on improving transport services to meet the needs of NSW residents. We would like to thank the more than 34,000 people who provided their feedback, either online or face-to-face, for the most recent research, conducted in May 2024. ##Public Transport in NSW## Passengers impacted by disruptions due to adverse weather. Severe adverse weather events in early 2024 affected our public transport passengers, resulting in a slight decline in satisfaction with train timeliness. However, satisfaction with the ‘availability of information about service delays’ has slightly increased compared with six months ago. As preparation continued during May for the new Sydney Metro expansion, passengers were kept well informed to what to expect with changes to services. Consequently, passengers have remained highly satisfied, particularly with the ‘knowledge of staff’ and ‘information about delays’. As public transport patronage continued to increase, satisfaction levels for comfort and ‘personal space’ have slightly decreased for buses, light rail and ferries. ##Road## Severe weather in early 2024 also impacted road users in NSW, leading to a decline in satisfaction with journey time reliability for private vehicles and motorcycles across the state. Heavy vehicle users have previously reported low satisfaction with rest areas across NSW. We have been focusing on improving these facilities, and it’s encouraging to see that satisfaction levels have continued to rise. Active transport users remain highly satisfied, with cyclists increasingly pleased with the ‘ease of connecting to public transport’ and pedestrians appreciating ‘sharing footpaths with others safely’. ##Point-to-Point## Satisfaction among users of point-to-point services (taxis, rideshares and hire cars) remains stable overall, with customers most satisfied with their accessibility and convenience. ##What’s Next## We will continue engaging with our passengers to gain deeper insights into their experiences across NSW’s transport network. This feedback will guide us in prioritising areas of low and declining satisfaction, helping us work towards delivering a consistently positive experience throughout their journey.6last year
- The NSW Rest Areas dataset provides information on rest area sites managed by Transport for NSW (TfNSW) and other authorities, including local councils and the National Parks and Wildlife Service (NPWS). The dataset includes details such as the rest area name, vehicle category, access direction, and different facilities, e.g. toilets, picnic tables, playground etc., that are available at each site. The dataset does not include TfNSW managed inspection bays. In November 2024, 173 additional rest areas were added to the dataset and 59 rest areas were removed. There have been data changes to the following attributes: responsible_authority, rest_area_name, site_status, latitude, longitude, distance_from, ne_unique, carriageway_configuration, side_of_road, category, vehicle_type, shade, power_outlets, litter_bins, accessible, access_direction, lighting, tree_shading, tourist_information, bbq, picnic_table, toilets, baby_change_facilities, caravan_disposal, power_supply, food_available, fuel_available, pets_allowed and water_supply_type. The NSW Rest Areas dataset can be queried by API for use by the public and industry. **API will only provide extracts in JSON and GeoJSON format. For other spatial formats please download below.**8last year
- Shapefiles for known clearways, bus lanes and transit lanes within Sydney Region. The dataset may not be complete.2last year
- last year
- This dataset provides data professionals and road safety analysts direct access to road crash data. Ready access to this data helps you take on more detailed research and evaluation that can contribute to better understanding of crashes and risks and improve road safety in the context of Safe Systems. Safe systems recognises that issues relating to infrastructure, vehicles, speed, and drivers cannot be viewed in isolation, but rather their interactions need to be considered. This data will provide a view of crash locations and environmental conditions as well as the involved vehicle types and the drivers and people who are injured or lose their lives. Publication of data will comply with the Privacy and Personal Information Protection Act 1998, which ensures sensitive information is not included in this proposed sets of data to be released. Five years of crash data will be initially published with updates to be made annually. Transport for NSW also has a significant amount of crash information available on the Centre for Road Safety website, which is presented in an easy to view way to investigate trends and factors contributing to crashes in NSW: [Interactive Crash Statistics](https://roadsafety.transport.nsw.gov.au/statistics/interactivecrashstats/index.html)9last year
- This dataset provides an indicator of historic light rail occupancy for individual light rail services from 31 May 2021. Note that L1 data is currently not available. The legacy Light Rail Opal Allocation Model (LOAM) will be replaced with a new Near Real Time (NRT) LOAM from the 6 August 2024.2last year
- TPA has a range of location information products which include digitised boundaries. Travel Zones (TZs) are the geographic units of TPA’s data collection, transport modelling and analysis. They are designed to align as much as possible with current Australian Bureau of Statistics (ABS) geographic classification for that year, to allow for comparison of different data sources at standard geographies. In order to provide for a similar level of trip generation across zones, TZs are designed to be small in areas with high land use densities and larger in areas of lower density. The key land uses of interest in defining TZs are employment, housing and transport infrastructure. As urban areas change over time, TPA creates a new zoning system in line with each 5-yearly population Census. Digitised boundaries for these zoning systems and equivalences between them, are available to users to undertake spatial analysis. 1991 – 2006 – Australian Standard Geographical Classification (ASGC), with Statistical Local Areas (SLA), Census Collection District (CCD) and Mesh Blocks (MB). Prior to 2006, TZs aligned to Statistical Local Areas (SLA). GMA may change slightly at the boundary to align with ABS geographic classifications. This will not usually impact on the comparison of data over time.2last year
- Your one-stop shop for all things active transport. Active transport provides tangible benefits by increasing daily physical activity levels and reducing greenhouse gas emissions through a reduction in cars on the road. Other benefits include improved social well-being and a greater sense of community. This data set contains links to the various data sets available on the Open Data Hub that relate to Active Transport. * [Pop Up Cycleway](https://opendata.transport.nsw.gov.au/dataset/sydney-region-pop-cycleway) * [Cycling Propensity](https://opendata.transport.nsw.gov.au/dataset/cycling-propensity) * [Cycling Count](https://opendata.transport.nsw.gov.au/dataset/cycling-count) * [Cycle Network - City of Sydney](https://opendata.transport.nsw.gov.au/dataset/city-sydney-cycle-network) * [Cycleway Data](https://opendata.transport.nsw.gov.au/dataset/infrastructure-cycleway-data) * [Sydney Spring Cycle 2017 - Road Closures](https://opendata.transport.nsw.gov.au/dataset/sydney-spring-cycle-2017-road-closures) * [Smart Pedestrian Project](https://opendata.transport.nsw.gov.au/dataset/smart-pedestrian-project) * [Active Transport: Walking](https://opendata.transport.nsw.gov.au/dataset/active-transport-walking) * [Smart Cities Macquarie Park](https://opendata.transport.nsw.gov.au/dataset/smart-cities-macquarie-park) * [Walking Count Sites](https://opendata.transport.nsw.gov.au/dataset/walking-count-sites) * [Eurobodalla Shire Council Cycleway](https://opendata.transport.nsw.gov.au/dataset/eurobodalla-shire-council-cycleway) * [UNSW Bicycling Dashboards](https://opendata.transport.nsw.gov.au/dataset/unsw-bicycling-dashboards)1last year
- This spatial dataset includes the train lines generated from the shape.txt file in the Sydney Trains GTFS static bundle. Spatial route datasets included in the following formats and will be updated on a monthly basis: - csv - geojson - json - kml - shapefile7last year
- This dataset details the road closures for the Sydney Spring Cycle 2017 on the 15th October 20174last year
- This dataset provides Local Area Guides for 13 Metro Stations along the Sydney's Metro North West Line. Each guide displays a local area map with an approximate 600m radius around the Metro station capturing bus stands, facilities, tickets and destinations. **Note:** * 12 new WCAG 2.0 compliant wayfinding maps have been added for the Chatswood to Sydenham extension, including 6 new station & local area maps and 6 existing station & local area maps in July 2024. * The M1 route, Metro North West & Bankstown Line will commence operations Sunday 4 August 2024. For an interactive guide to each of these Metro stations visit [https://transportnsw.info/travel-info/ways-to-get-around/metro#/](https://transportnsw.info/travel-info/ways-to-get-around/metro#/).25last year
- TPA has a range of location information products which include digitised boundaries. Travel Zones (TZs) are the geographic units of TPA’s data collection, transport modelling and analysis. They are designed to align as much as possible with current Australian Bureau of Statistics (ABS) geographic classification for that year, to allow for comparison of different data sources at standard geographies. Geographic coverage – Sydney Greater Metropolitan Area (GMA) In order to provide for a similar level of trip generation across zones, TZs are designed to be small in areas with high land use densities and larger in areas of lower density. The key land uses of interest in defining TZs are employment, housing and transport infrastructure. As urban areas change over time, TPA creates a new zoning system in line with each 5-yearly population Census. Digitised boundaries for these zoning systems and equivalences between them, are available to users to undertake spatial analysis. 1991 – 2006 – Australian Standard Geographical Classification (ASGC), with Statistical Local Areas (SLA), Census Collection District (CCD) and Mesh Blocks (MB). Prior to 2006, TZs aligned to Statistical Local Areas (SLA). GMA may change slightly at the boundary to align with ABS geographic classifications. This will not usually impact on the comparison of data over time.3last year
- Transport Performance and Analytics (TPA) has a range of location information products which include digitised boundaries. Travel Zones (TZs) are the geographic units of TPA’s data collection, transport modelling and analysis. They are designed to align as much as possible with current Australian Bureau of Statistics (ABS) geographic classification for that year, to allow for comparison of different data sources at standard geographies. In order to provide for a similar level of trip generation across zones, TZs are designed to be small in areas with high land use densities and larger in areas of lower density. The key land uses of interest in defining TZs are employment, housing and transport infrastructure. As urban areas change over time, TPA creates a new zoning system in line with each 5-yearly population Census. Digitised boundaries for these zoning systems and equivalences between them, are available to users to undertake spatial analysis. 1991-2006 - Australian Standard Geographical Classification (ASGC), with Statistical Local Areas (SLA), Census Collection District (CCD) and Mesh Blocks (MB). Prior to 2006, TZs aligned to Statistical Local Areas (SLA) Note that GMA may change slightly at the boundary to align with ABS geographic classifications. This will not usually impact on the comparison of data over time.8last year
- Transport Performance and Analytics (TPA) has a range of location information products which include digitised boundaries. Travel Zones (TZs) are the geographic units of TPA’s data collection, transport modelling and analysis. They are designed to align as much as possible with current Australian Bureau of Statistics (ABS) geographic classification for that year, to allow for comparison of different data sources at standard geographies. In order to provide for a similar level of trip generation across zones, TZs are designed to be small in areas with high land use densities and larger in areas of lower density. The key land uses of interest in defining TZs are employment, housing and transport infrastructure. As urban areas change over time, TPA creates a new zoning system in line with each 5-yearly population Census. Digitised boundaries for these zoning systems and equivalences between them, are available to users to undertake spatial analysis. Travel Zones fit within ABS SA2. Note that GMA may change slightly at the boundary to align with ABS geographic classifications. This will not usually impact on the comparison of data over time.4last year
- The City of Sydney supports car sharing to enable more sustainable travel habits and helps keep businesses and residents connected. This data is provided by City of Sydney and provides the approximate location of car share bays and is not an indication of car availability. The following car share operators will have up-to-date locations: * Car Next Door * Flexicar * GoGet * Popcar The API provides data in GeoJSON format. For more information visit [City of Sydney Car share bay operator](https://data.cityofsydney.nsw.gov.au/datasets/car-share-bay-operator?geometry=150.877%2C-33.937%2C151.530%2C-33.837).4last year
- This dataset encompasses all railway level crossings on public roads in New South Wales that are currently documented in the Australian Level Crossing Assessment Model (ALCAM) database. The data is based on information provided by road/rail managers and external contractors.8last year
- The taxi rank API provides information about selected taxi ranks in NSW. It provides real time and and historical information about taxis activity and passengers count at the taxi ranks. Central Station Taxi Rank feed has been decommissioned as of August 2021.12 years ago
- This dataset provides WCAG 2.0 compliant wayfinding maps for 13 Metro Stations along the Metro North West Line, including 8 new metro stations and 5 upgraded stations. Metro services are high-frequency, driverless trains, which can quickly take you between stations operating every 4 minutes in peak times. Each map displays the transport connections, customer assistance available, facilities available, tap on / tap off points, and lift / escalator locations. The line is being extended into the Sydney CBD and beyond, in 2024. **Note:** * 13 new WCAG 2.0 compliant wayfinding maps have been added for the Chatswood to Sydenham extension, including 6 new station & local area maps and 7 existing station & local area maps in July 2024. * The M1 route, Metro North West & Bankstown Line will commence operations August 2024.262 years ago
- Table outlining the official capacity limits for the ferry fleet. Includes the different classes and vessels.12 years ago
- This dataset provides an indicator of historic rail occupancy for individual rail services from July 2019. Data included in ROAM - Rail Opal Assignment Model - includes Sydney Trains (T1 - T9) and Metro (Metro North West line) services. Note: With the introduction of the new City and Southwest Metro line, Transport is moving to a new Opal Allocation Model to handle the complexity that these new services will bring. The legacy Rail Opal Allocation Model (ROAM) data will be replaced with a new Near Real Time (NRT) ROAM from May 2024.22 years ago
- The Key Roads Performance report outlines the time it takes to travel along major road routes in NSW during peak periods. The trips described in this report cover many major roads in Sydney, Newcastle, and Wollongong. Other key roads in NSW will be added in future reports as the report is refined, and additional roads may be included to address community needs. For each trip, this report provides the travel time during the AM and PM peak periods and a detailed description of the trip. The report is issued monthly, starting with October 2018 until June 2019. For more information visit [RMS Key Performance Report](https://www.rms.nsw.gov.au/about/corporate-publications/roads-report.html)92 years ago
- This dataset contains plans of Airport Link Company ([https://www.airportlink.com.au/](https://www.airportlink.com.au/)) stations. These stations are not included in the Station CAD Drawings datasets.42 years ago
- NorthConnex is a nine kilometre twin tunnel linking the M1 Pacific Motorway at Wahroonga to the Hills M2 Motorway at West Pennant Hills in Sydney’s north. It will deliver significant benefits to local communities by easing congestion and removing up to 5000 trucks per day from Pennant Hills Road. This will help improve safety, benefit local air quality and reduce traffic noise. For more information visit [NorthConnex](https://www.northconnex.com.au/). For an interactive map visit [NorthConnex Tracker](https://construct.northconnex.com.au/interactive-maps). Please read a [Guide to using NorthConnex for trucks and buses](https://www.rms.nsw.gov.au/documents/business-industry/heavy-vehicles/safety-compliance/pennant-hills-road-regulation/northconnex-truck-bus.pdf) for some quick facts. This dataset includes tunnel alignment CAD files.12 years ago
- Current vehicle positions in GTFS-realtime format for Metro and Sydney Trains.22 years ago
- This is a dataset that contains the Toll Information. Please refer to [https://www.rms.nsw.gov.au/sydney-motorways/toll-charges/index.html](https://www.rms.nsw.gov.au/sydney-motorways/toll-charges/index.html) for the updated toll charges.32 years ago
- Stop time updates for active trips, replacement vehicles, and changed stopping patterns in GTFS-realtime format for Metro and Sydney Trains.22 years ago
- This dataset contains the Opal patronage data for train, bus, ferry and light rail since January 2020. The data is available by public transport mode, day of the week and of key commercial centres in greater Sydney and regional NSW.22 years ago
- Location of Sydney CBD kerbside loading zones (for use by delivery vehicles when loading or unloading goods) by street and time of day (hourly). Returns ZIP file containing JSON and CSV files52 years ago
- Static timetables, stop locations, pathways for trains, and route shape information in GTFS format for operators that support realtime.12 years ago
- A carriageway is width of roadway for the movement of vehicles. There are single carriageways and dual carriageways represented as single or dual lines in the spatial representation. This dataset contains the the number of through lanes, the width of the through lanes and the surfaced width for State Roads. There are also non-state roads in the dataset, which commonly only contain lengths and no widths.22 years ago
- Thirty Minute City and Metro Strategic Centre Catchments is a foundation of the [Future Transport Strategy](https://future.transport.nsw.gov.au/future-transport-strategy/greater-sydney-network). Thirty Minute City establishes a metropolitan transport network which reinforces the metropolis of three cities, particularly the delivery of a 30-minute city where most residents in each city can access their metropolitan centre or cluster within 30 minutes by public transport. Metro Strategic Centre Catchments develops a network of 34 strategic centres with jobs, goods and services supported by a public transport, walking and cycling network. This would provide residents with a 30-minute public transport service to their nearest strategic centre seven days a week. The image below shows the thirty minute city catchments to the different strategic centre catchments. 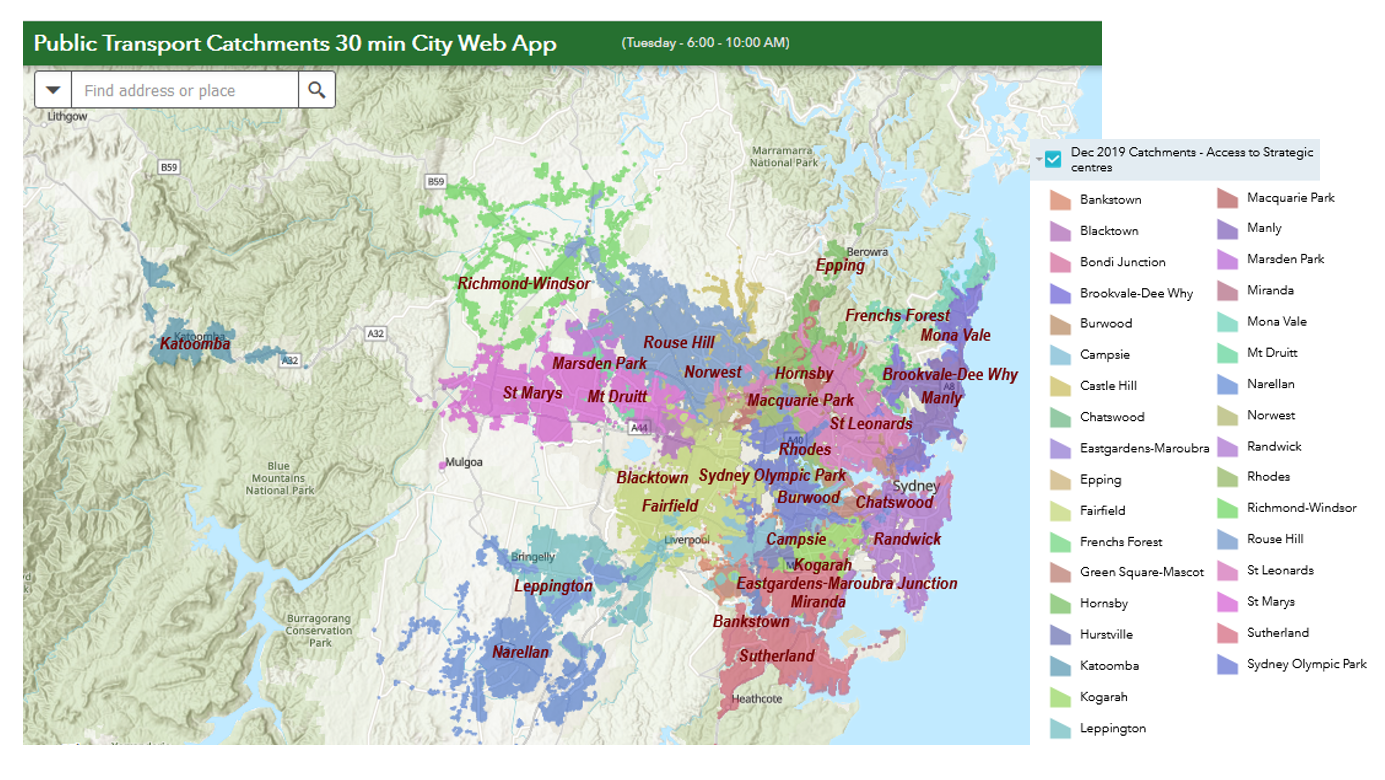 The Thirty Minute City and Metro Strategic Centre Catchments Document provides you with detailed information regards the background of this initiative and the datasets used.22 years ago
- The Cycling CVP report investigates how we can encourage customers in NSW to cycle more often. The reports identify 4 key areas: 1. Connectivity and flow of footpaths to public transport and centres 2. Pedestrian safety and personal security 3. Health and well being benefits 4. Supporting facilities including complete shade or rain coverage on key routes and at interchanges These reports provide a detailed analysis of why the research was conducted, what influences cycling in NSW, what is important to the NSW population, and how do needs differ across the NSW population.12 years ago
- In 2016, Transport for NSW conducted four surveys to measure customer satisfaction levels across the NSW public transport system. This dataset provides the results of the surveys.22 years ago
- This dataset provides counts of tap ons and tap offs made on the Opal ticketing system during four non-consecutive weeks in 2020. The Opal tap on and tap off dataset contains 16 CSV files covering four weeks (28 days) of Opal data across the four public transport modes. Privacy is the utmost priority for all Transport for NSW Open Data and there is no information that can identify any individual in the Open Opal Tap On and Tap Off data. This means that any data that is, or can be, linked to an individual’s Opal card has been removed. This dataset is subject to [specific terms and conditions](https://opendata.transport.nsw.gov.au/sites/default/files/Opal%20Data%20Terms%20and%20Conditions%20v1.pdf). The CSV files (one for each week) are: 1. Tap on and off time 2. Tap on and off location 3. Tap on and off time and location 4. Origin and destination by travel zone Reported taps are a combination of Opal card and Contactless Transport Payment (CTP) transactions. The tap on and tap off counts are not linked and individual trips cannot be derived using the data. The 28 days are: \* Monday 24 Feb 2020 – Sunday 01 March 2020 \* Monday 23 March 2020 – Sunday 29 March 2020 \* Monday 24 August 2020 – Sunday 30 August 2020 \* Monday 16 November 2020 – Sunday 22 November 2020 *Release 1 and Release 2 of the data is linked in the Related Content below.*202 years ago
- This dataset contains historical GTFS and GTFS Realtime data. The GTFS Realtime data includes GTFS vehicle position, GTFS trip update and GTFS timetable. Initially, it provides Metro and Ferry data and include other modes over time.22 years ago
- Released under formal Government Information Public Access (GIPA) Application to Department of Finance, Services and Innovation (DFSI) - FA#98 15-16 1. The number of camera detected speeding penalty notices in each postcode (postcode of the address of the offender) in the 2013/14 financial year. 2. The number of camera detected speeding penalty notices in each postcode (postcode of the address of the offender) in the 2014/15 financial year. 3. The number of penalty notices issued by NSW Police for speed related offences in each postcode (postcode of the address of the offender) in the 2013/14 financial year. 4. The number of penalty notices issued by NSW Police for speed related offences in each postcode (postcode of the address of the offender) in the 2014/15 financial year.12 years ago
- The Expired Marine Flares Collection Program for the 2020-2021 boating season started on 20 November 2020 and runs to 18 April 2021 at 46 locations along the coast from Tweed Heads to Eden. You can view dates and times of collections at each location within the resource provided. Collections are listed by their region and location. The [site map](https://www.rms.nsw.gov.au/maps/maritime_expired_flares_collection_sites) will help you find each location. Please note: Flare collection is no longer available at service centres, registries or maritime sites.12 years ago
- This data set contains station CAD (Computer Aided Design) drawings for the station names **D - G**. The CAD drawings are 2D detailing the layout and platforms of each station. Showing train direction, station entry and exit, facilities and more. The CAD drawings were provided in 2016 so some stations could also be dated/historical in terms of data and details or **unavailable to be published.**312 years ago
- Here you can find symbols and pictograms for all transport modes to use in your apps, products and other projects. Symbols and icons are available in various formats, while all can be found as vector files that can be opened directly in software such as Adobe Illustrator.252 years ago
- The official Transport for NSW trip planning widget is available to display on your own website. Your customers can plan their own trip and be directed to transportnsw.info. To see this widget's Terms of Use please click [here](/trip-planning-widget-terms-use).22 years ago
- This data is maintained by the Spatial Services Spatial Data Services. If you have any questions with regards to this dataset, please contact [SS-SDS@customerservice.nsw.gov.au](mailto:SS-SDS@customerservice.nsw.gov.au) Transport Facility Point is point feature class defining a facility related to transport. Data in the Transport Facility Point include: \* Parking Area - an area set aside for the parking of motor vehicles or aircraft \* Marina - an area provided with berthing and shore facilities (including toilets, water and rubbish disposal) particularly for yachts and other pleasure craft \* Railway Station - a place where passengers are exchanged between vehicles or between transport modes \* Helipad - a place for helicopters to land and take-off, like runway is to airport \* Roadside Rest Area - a formal area adjacent to the road enabling motorists to take fatigue breaks \* Roadside Emergency Telephone - a dedicated telephone adjacent to a road that provides public access to emergency services \* Airport - an airport is a listed, public or private known landing strip \* Bus Interchange - a connection or terminal point for long distance bus travellers or other major transport interchange \* Heavy Vehicle Check Station - a facility to ensure that heavy vehicles meet safety and road-worthiness standards and that their drivers are complying with road transport laws. Click on "Go to Resource" to view the data source.12 years ago
- Spot Parking is a private company participating in the Parking Innovation Challenge for the purpose of conducting a proof of concept trial for kerbside data mapping. The Spot Parking platform provides a group of APIs along with client libraries, language specific examples, and documentation to help you develop applications that integrate with Spot Parking. In addition, Spot Parking publishes a set of JSON Documents that provides for easy consumption by applications, but with a limited subset of data. This API is being made available for free to Open Data Hub users for a 12 month period from October 2020 to October 2021 as part of the Parking Innovation Challenge. For more information about the Parking Innovation Challenge - visit [https://opendata.transport.nsw.gov.au/parking-innovation-challenge](https://opendata.transport.nsw.gov.au/parking-innovation-challenge).92 years ago
- This dataset shows the minimum vertical clearance (in metres) of bridges over State Roads in NSW. This information is primarily for bridges on or over State Roads managed by Transport for NSW. With some exceptions, there is no information on structures on Regional or Local roads. Except for gazetted 4.6m clearance routes, a permit from Transport for NSW is required for any vehicle higher than 4.3m in height, to drive on State Roads. **Disclaimer** *The NSW State Roads Vertical Clearances dataset available on or from this website is intended as a general reference source and provided for information purposes only. Information, data and advice on this website is provided on the basis that site users are responsible for assessing the relevance and accuracy of its content. We make no representations, express or implied, as to the accuracy, currency or usefulness of the content of, or data available, on this site. Transport for NSW and the NSW Government accept no liability to any person for the information, data or advice (or the use of such information, data or advice) which is provided on this website or incorporated into it by reference.*12 years ago
- Summary of speed, parking, seat belt, red light, mobile phone, food and CINS penalty notices issued by issuing agency.12 years ago
- This dataset contains sample or test data to be used by app developers for feedback.152 years ago
- The data is available on the **[TfNSW Centre for Road Safety](https://roadsafety.transport.nsw.gov.au/statistics/index.html)** website. The site provides information on: 1. Interactive crash statistics with dynamic reports on road user deaths and injuries, locations and crash types. 2. Fatality trends that shows the number of road deaths per 100,000 population from 1908 onwards. 3. Serious injuries that show over the period from 2005 to 2015, about 30 people are hospitalised by crashes on NSW roads each day. 4. Reports and publications that you can download.42 years ago
- Patronage of Hillsbus Services before and after the opening of the Sydney Metro, released under the formal NSW Government Information Public Access (GIPA) Act 2009. The resource captures the following information: \* Opal Trips by route, by date. 6 May to 26 May 2019 \* Opal Trips by route, by date. 10 June to 30 June 2019 \* Tap Offs by route, stop and date. 6 May to 26 May 2019 \* Tap Offs by route, stop and date. 10 June to 30 June 201912 years ago
- UNSW has created an interactive dashboard from data that was acquired from Bicycle Network as collected through the RiderLog App. The maps are based on 120,085 GPS tracked cycling journeys by 7,601 cyclists from RiderLog app from May 2010 through December 2013. The anonymised data behind the dashboards can be downloaded from CityData at [https://citydata.be.unsw.edu.au/](https://citydata.be.unsw.edu.au/).22 years ago
- Transport Performance and Analytics (TPA) has a range of location information products which include digitised boundaries. Travel Zones (TZs) are the geographic units of TPA’s data collection, transport modelling and analysis. They are designed to align as much as possible with current Australian Bureau of Statistics (ABS) geographic classification for that year, to allow for comparison of different data sources at standard geographies. In order to provide for a similar level of trip generation across zones, TZs are designed to be small in areas with high land use densities and larger in areas of lower density. The key land uses of interest in defining TZs are employment, housing and transport infrastructure. As urban areas change over time, TPA creates a new zoning system in line with each 5-yearly population Census. Digitised boundaries for these zoning systems and equivalences between them, are available to users to undertake spatial analysis. 1991-2006 - Australian Standard Geographical Classification (ASGC), with Statistical Local Areas (SLA), Census Collection District (CCD) and Mesh Blocks (MB). Prior to 2006, TZs aligned to Statistical Local Areas (SLA) Note that GMA may change slightly at the boundary to align with ABS geographic classifications. This will not usually impact on the comparison of data over time.32 years ago
- This data explores the nature of walk trips in Sydney. The walking data featured here are from the Household Travel Survey (HTS), which is the largest and most comprehensive source of personal travel data for the Sydney Greater Metropolitan Area (GMA). The HTS collects data for all transport modes including walking.22 years ago
- Local Road Length data in meters (Segment Length) broken down by Local Government Area (LGA), Street Name and Road Administrative Class (Local, Regional, State or Unincorporated Area). Data refreshed monthly.12 years ago
- If you hold a mobility parking scheme permit, you can enjoy free parking for a certain period of time in designated parking zones. This applies to parking zones with meters or ticket machines. This dataset shows location and parking space information for mobility parking in the City of Sydney area.12 years ago
- The information featured here include data from the 2012 Sydney Cycling Survey (SCS). The SCS surveys over 11,000 individuals from 4,000 households. It collects information about cyclists, cycling trips, cycling participation and cycling mode share. Publications about cycling using data from the Household Travel Survey, Census of Population and Housing, and bicycle counters are also available.42 years ago
- This data is maintained by the DCS Spatial Services. If you have any questions with regards to this dataset, please contact [https://www.spatial.nsw.gov.au/contact\_us](https://www.spatial.nsw.gov.au/contact_us) Traffic control devices are used to control, calm, slow or impede the movement of traffic. Sub types that form this feature class includes: \* Gate - a structure used to regulate movement associated with road or rail \* Impediment - a structure generally associated with a road that controls or varies the normal travel of vehicles or pedestrians. \* Level Crossing - a place where a road and railway intersect at the same level \* Toll Booth - a structure on a road which requires the user to pay a toll or fee to use the road \* Cattle Grid - an open floored structure designed to be crossed by motor vehicles \* Roundabout The notional midpoint of a roundabout that has been constructed to allow smooth integration of traffic. Generally only roundabouts forming a road centreline and associated with Road Segments classified as 'Roundabout' will be identified under this classification. Click on "Go to Resource" to view the data source.12 years ago
- **Smart Cities, Smart Liverpool, Smart Pedestrian Project** Thousands of people walk through the Liverpool city centre every day and, through the Smart Pedestrian Project, the paths they take will help shape the city’s future. Liverpool City Council is counting pedestrian and vehicle movements around the city centre, collecting data from smart devices and camera-counting technology. The data is stripped of any identification and relayed and collected for analysis by researchers from the University of Wollongong. Liverpool City Council now uses this data to inform planning decisions and respond to the rising number of residents and workers making their way around the city centre every day. Liverpool City Council secured an Australian Government Smart Cities and Suburbs grant to jointly fund the project. Liverpool City Council worked with IT Integration Company Meshed and the University of Wollongong to deliver the technology. Meshed supplied the Low Power Wide Area Network and developed a Wi-Fi smart device counter. The university developed the people and vehicle-counting technology and data analysis. The technology makes use of the city’s existing CCTV cameras to capture images. No images are transmitted over the network, so there is no risk to privacy. This dataset lists the API endpoint URLs to retrieve data for the smart pedestrian project. A dashboard to view the data can be found at [https://pavo.its.uow.edu.au/](https://pavo.its.uow.edu.au/) **Please read the API documentation as you need to provide the parameters to make any API calls.** An example has been provided below that lists all the visual sensors. The API is divided in two sections: sensors, and readings (data gathered by sensors). Unless otherwise noted: \* all datetimes are ISO formatted \* all responses are JSON-formatted62 years ago
- This dataset contains a snapshot of commuting patterns for Census day 2001 (Tuesday 7th August). It is a complete enumeration via a self-completion Census form. The scope of JTW is employed persons aged 15 years and over, who were employed during the week before Census night, and with a workplace in NSW. JTW data may produce slightly different counts to those obtained directly from the Australian Bureau of Statistics (ABS) for the same geographic level due to: * ABS confidentialising process is applied to the data that TPA purchases (randomisation of small cells) * Further validation and adjustment of the data undertaken by TPA * Imputation of records of incomplete addresses to eliminate locality ‘dump’ codes ABS data is used with permission from the Australian Bureau of Statistics332 years ago
- This dataset includes the final Technical Note and accompanying GIS datasets delivered by Cardno and UNSW for their proof-of-concept Passive Surveillance Index (PSI) trial in Parramatta, through TfNSW’s Safety After Dark Innovation Challenge (SADIC). The PSI scores walking routes based on quantifiable indicators. The tool may be a starting point for planners to make informed decisions on how safe cities may factor passive surveillance into their design. The [web map](https://cardnoanz.maps.arcgis.com/apps/webappviewer/index.html?id=82110546dbce47f58a4bbb47e94a6779) visually displays the PSI for different times of the night across the trial area. This website works best using the Google Chrome browser. Contact: Elizabeth Muscat, [elizabeth.muscat@cardno.com.au](mailto:elizabeth.muscat@cardno.com.au) Output: the SADIC PSI Data zip file and technical report22 years ago
- This dataset provides estimates of train loads during the AM and PM peak periods - derived from a survey held on Tuesdays, Wednesdays and Thursdays from 1 March 2016 to 17 March 2016. The primary purpose of the train load surveys is to support service planning and rail timetabling. Surveys are conducted in March and September. March loads are the preferred dataset for network planning as it reflects the busiest time of year for train travel and is less subject to seasonal factors. The March loads are usually higher and provide a better gauge of rail system performance.12 years ago
- This data set contains station CAD (Computer Aided Design) drawings for the station names **P - R**. The CAD drawings are 2D detailing the layout and platforms of each station. Showing train direction, station entry and exit, facilities and more. The CAD drawings were provided in 2016 so some stations could also be dated/historical in terms of data and details or **unavailable to be published.**272 years ago
- **This information is provided by Liverpool City Council** Air Quality sensors were installed across the Liverpool CBD through the Liverpool Smart Pedestrian Project in 2018. The project was co-funded by Council and the Australian Government Smart Cities and Suburbs Grant. The sensors were designed by University of Wollongong, a partner on the project. They measure PM2.5 and PM10. Use the Go to Resource to view the data source.12 years ago
- Transit lanes can be used by vehicles containing a certain number of people. Public buses and minibuses, taxis, hire cars with HC number plates, motorcycles and bicycles, as well as emergency, special purpose and breakdown vehicles, can also use transit lanes, regardless of the number of people in their vehicles. Transit lanes can only be used during the times and days specified on the sign when there are two or more people in a vehicle, including the driver. If there are less than the required number of people in the vehicle, a transit lane can only be entered for a maximum of 100m to: \* Enter or leave the road \* Overtake another vehicle turning right or making a U-turn \* Enter a lane from the side of the road. **Please be advised this data is valid as at 2008.** Also it demarcates the location of where the transit lanes are stamped on the road, not necessarily of the extent of the lanes themselves.12 years ago
- Image URL, GPS coordinates, and view description of traffic cameras in GeoJSON format12 years ago
- There have been a number of requests for "State Roads" data. This data is currently available via the Data.NSW Spatial Collaboration Portal. To access Road Segment Data please follow the instructions below; 1. From [https://portal.spatial.nsw.gov.au/](https://portal.spatial.nsw.gov.au/) 2. Click the *Browse Data* tile 3. Click *NSW Data themes* tile 4. Click the *Transport* icon 5. Click the link [NSW Transport Theme - Road Name Extent](https://portal.spatial.nsw.gov.au/portal/apps/sites/#/home/items/d05fb8d70c4c42bd859e8b8cae60a387) 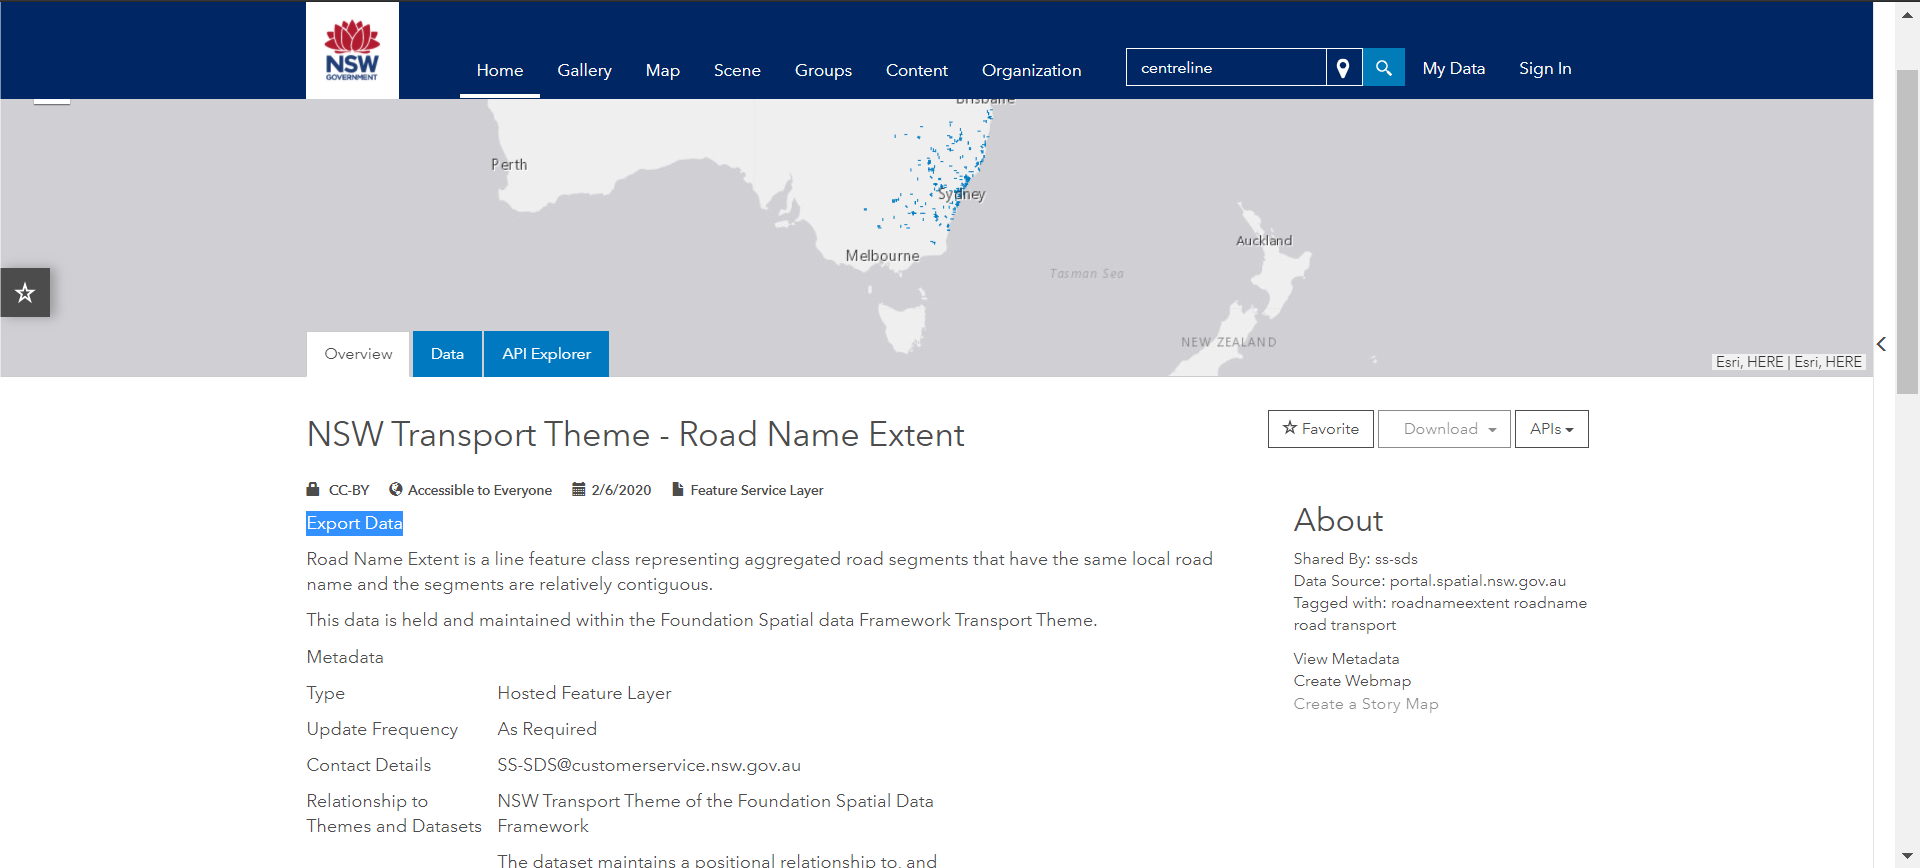 6. Click on Export Data (highlighted above) 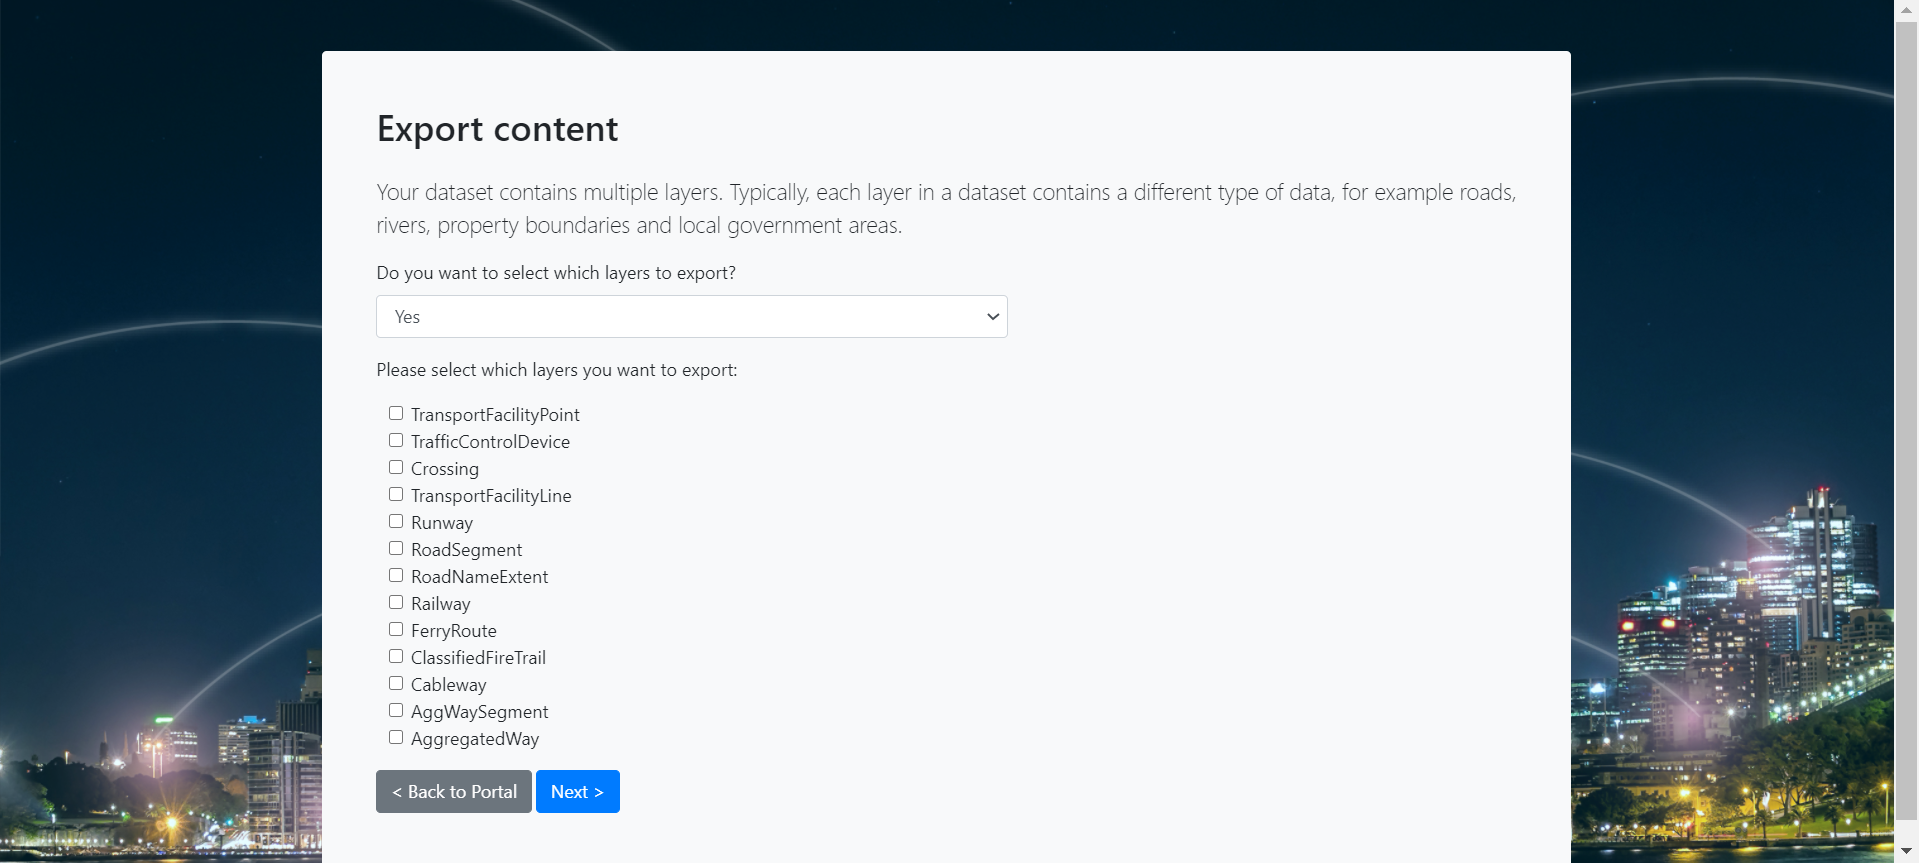 7. **Do you want to select which layers to export?** You can select *Yes* and choose from the layers provided OR you can select *No Thanks. I want to export data from all layers*. This will download all data sets. In the example below RoadNameExtent is selected. 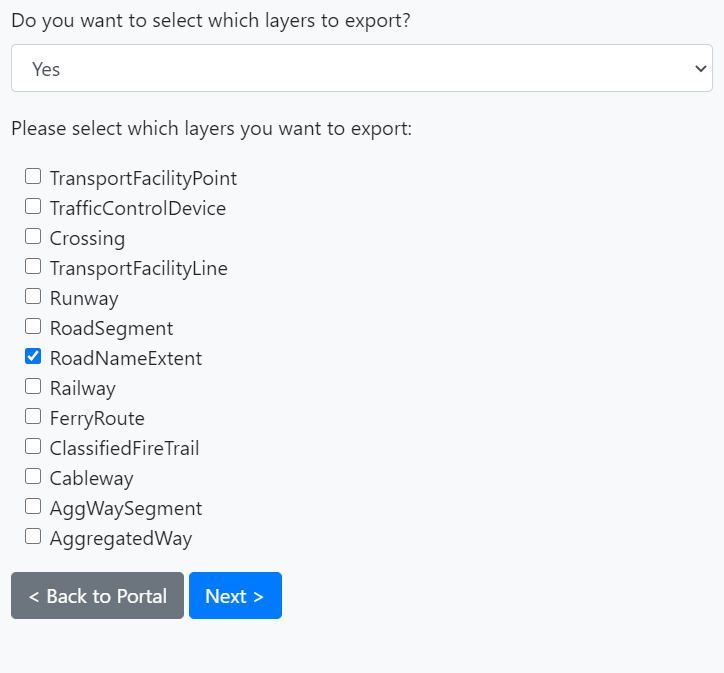 8. Click *Next* > 9. **Do you want to specify an extent**? Select No or *Yes, by drawing the extent on a map*. If you select ‘No’ all the data will be extracted. If you wanted to specify an extent of data extraction, e.g. around Sydney in the screenshot below, use the square icon labelled ‘Draw a rectangle’. This will draw a square centred on the point where you clicked on the map. You can change the shape from the icon labelled ‘Reshape’ to get the required area of extraction. 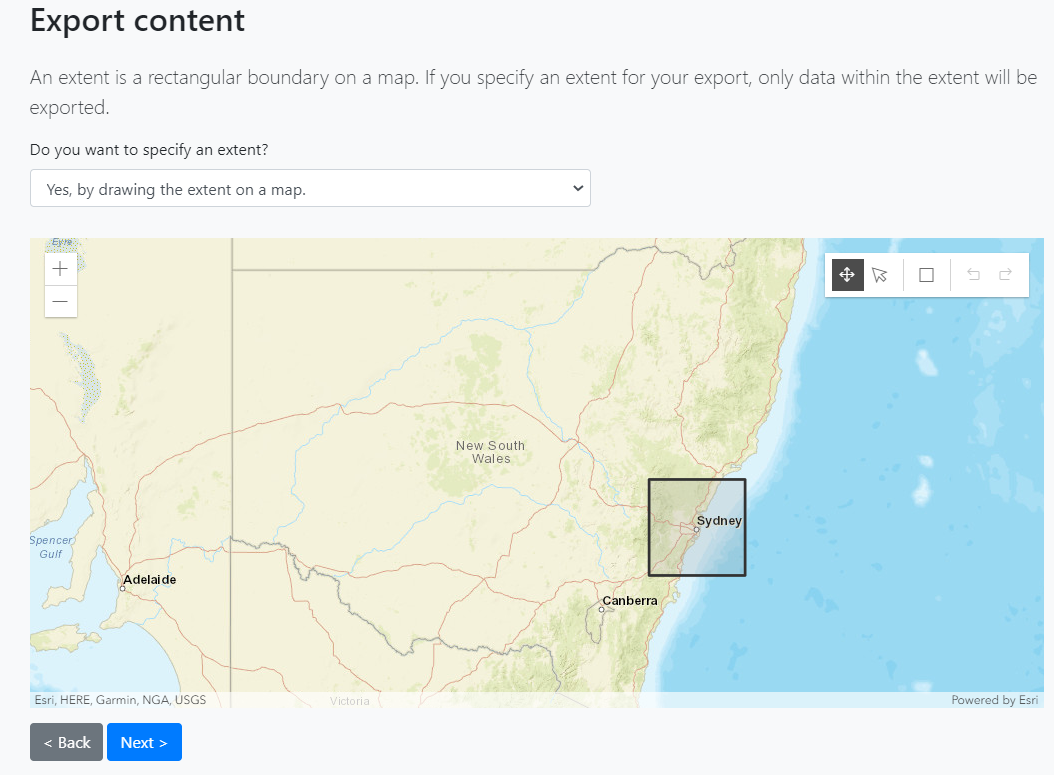 10. Click on *Next* > 11. Select your preferred Export format. Please note the limitation of ESRI Shape files truncating attribute names to 10 characters. 12. Select your preferred Export datum: Please note the current preference of GDA2020, although that depends on your objective. 13. Select your preferred Export coordinate system: ‘Geographic’ will export the geometries in latitude/longitude. MGAxx coordinate systems will export the geometries in metres. 14. Type your email address 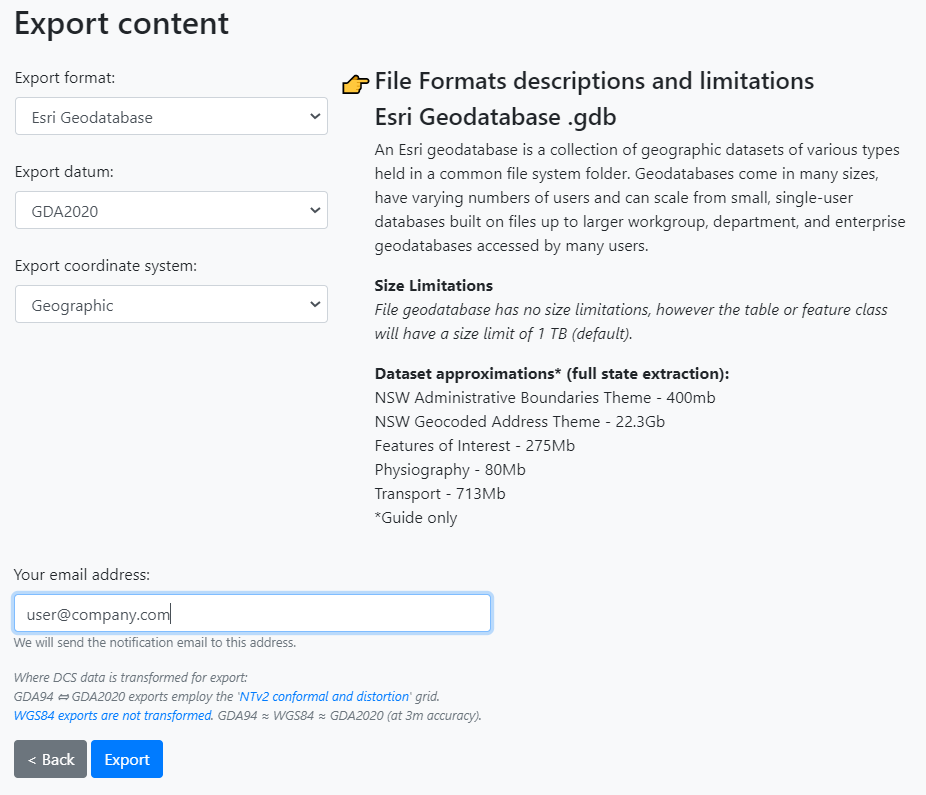 15. Click *Export* 16. You should see the screen below 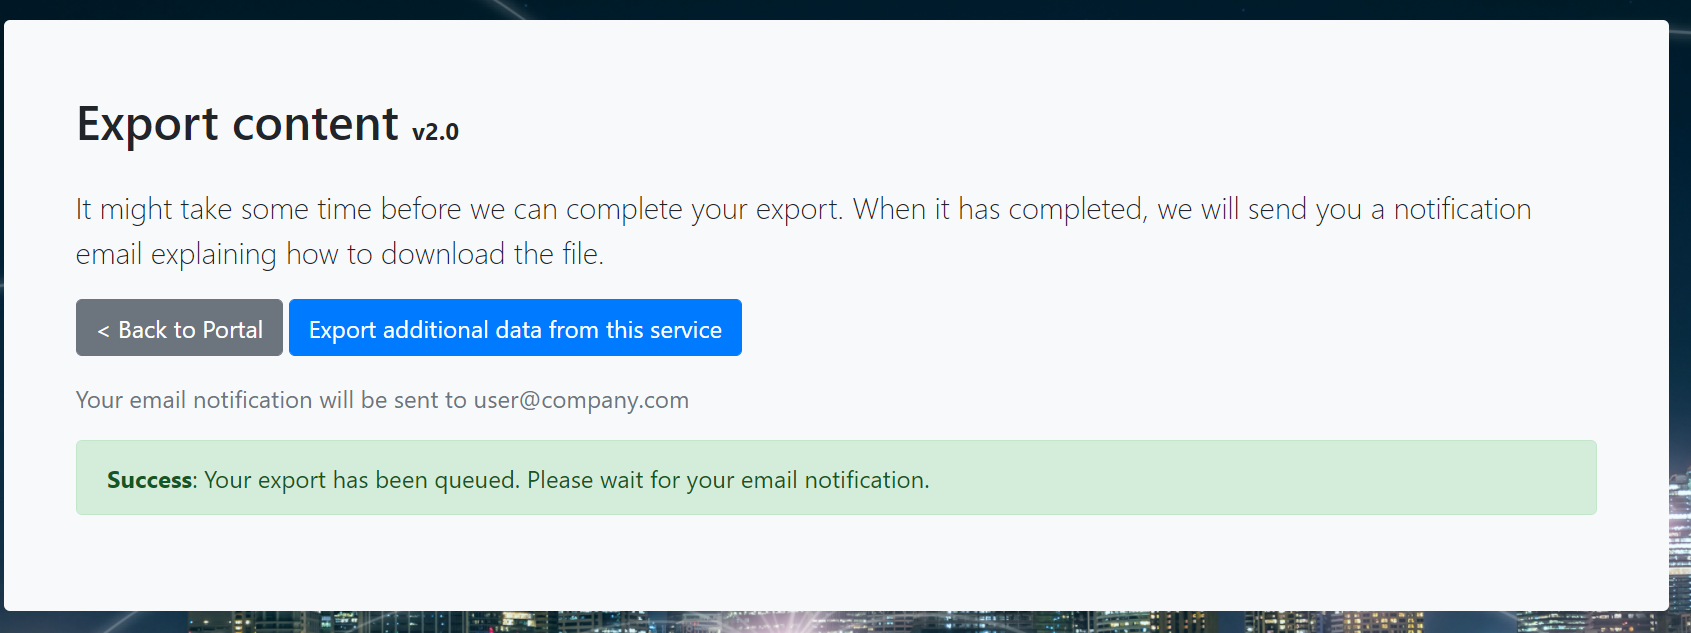 17. Check your inbox for an email from Customer Service with a link to download the data.12 years ago
- Sydney Trains GTFS More Trains More Services data feed and a route reference file that we use to map the route ID to the lines in the trip planner.22 years ago
- Street lighting is a vital community asset that helps our community feel safer and more secure. Ausgrid maintains streetlights within our network area on behalf of local councils across Sydney, the Central Coast and the Hunter. This dataset contains locations for 1509 street light locations. For a searchable map of their locations please visit [https://www.ausgrid.com.au/In-your-community/Our-services/Streetlights#!/map.](https://www.ausgrid.com.au/In-your-community/Our-services/Streetlights#!/map)22 years ago
- This dataset provides an indicator of historic bus occupancy for individual bus services from January 2020.22 years ago
- This data is maintained by the Spatial Services Spatial Data Services. If you have any questions with regards to this dataset, please contact [SS-SDS@customerservice.nsw.gov.au](mailto:SS-SDS@customerservice.nsw.gov.au) The data is a line feature class representing roads and fire trails that form part of the NSW strategic fire trail network as described in the Bush Fire Coordinating Committee, Policy No 1/03 "Guidelines for the Classification of Fire Trails". The fire trail network identifies roads and fire trails that are maintained to ensure safe four-wheel drive access to and from fire grounds. This line feature dataset is part of the NSW Transport Theme. Where possible, line geometries of the classified fire trail dataset align to the topographic and cadastral databases. Click on "Go to Resource" to view the data source.12 years ago
- This dataset contains City of Sydney interactive maps that show Parking Permit Areas, Parking Meter Status, and Ticket Parking Rates. For more information visit [https://data.cityofsydney.nsw.gov.au/search?q=parking](https://data.cityofsydney.nsw.gov.au/search?q=parking)32 years ago
- PTAL is a measure of connectivity by public transport, which has been used in various planning processes for many years. For any selected place, PTAL suggests how well the place is connected to public transport services. It does not cover trips by car. The PTAL model calculates December 2019 public transport accessibility for every 2016 ABS Mesh Block in New South Wales. The TfNSW PTAL model is based on the Transport for London (TfL) PTAL and was adapted for TfNSW in collaboration with the Spatial Information Science team at the Department of Earth and Environmental Sciences, Macquarie University. The [Assessing transport connectivity in London](http://content.tfl.gov.uk/connectivity-assessment-guide.pdf) explains what PTAL is, how to understand the data and more. PTAL values are simple. They range from zero to six, where the highest value represents the best connectivity. A location will have a higher PTAL if: \* It is at a short walking distance to the nearest stations or stops \* Waiting times at the nearest stations or stops are short \* More services pass at the nearest stations or stops \* There are major rail stations nearby \* Any combination of all the above. Please read the PTAL documentation for more information. The format of the data is Arcgis geodatabase. **Images below show an example of what the data looks like at 8:00am (first image) and 1:00am (second image)**. 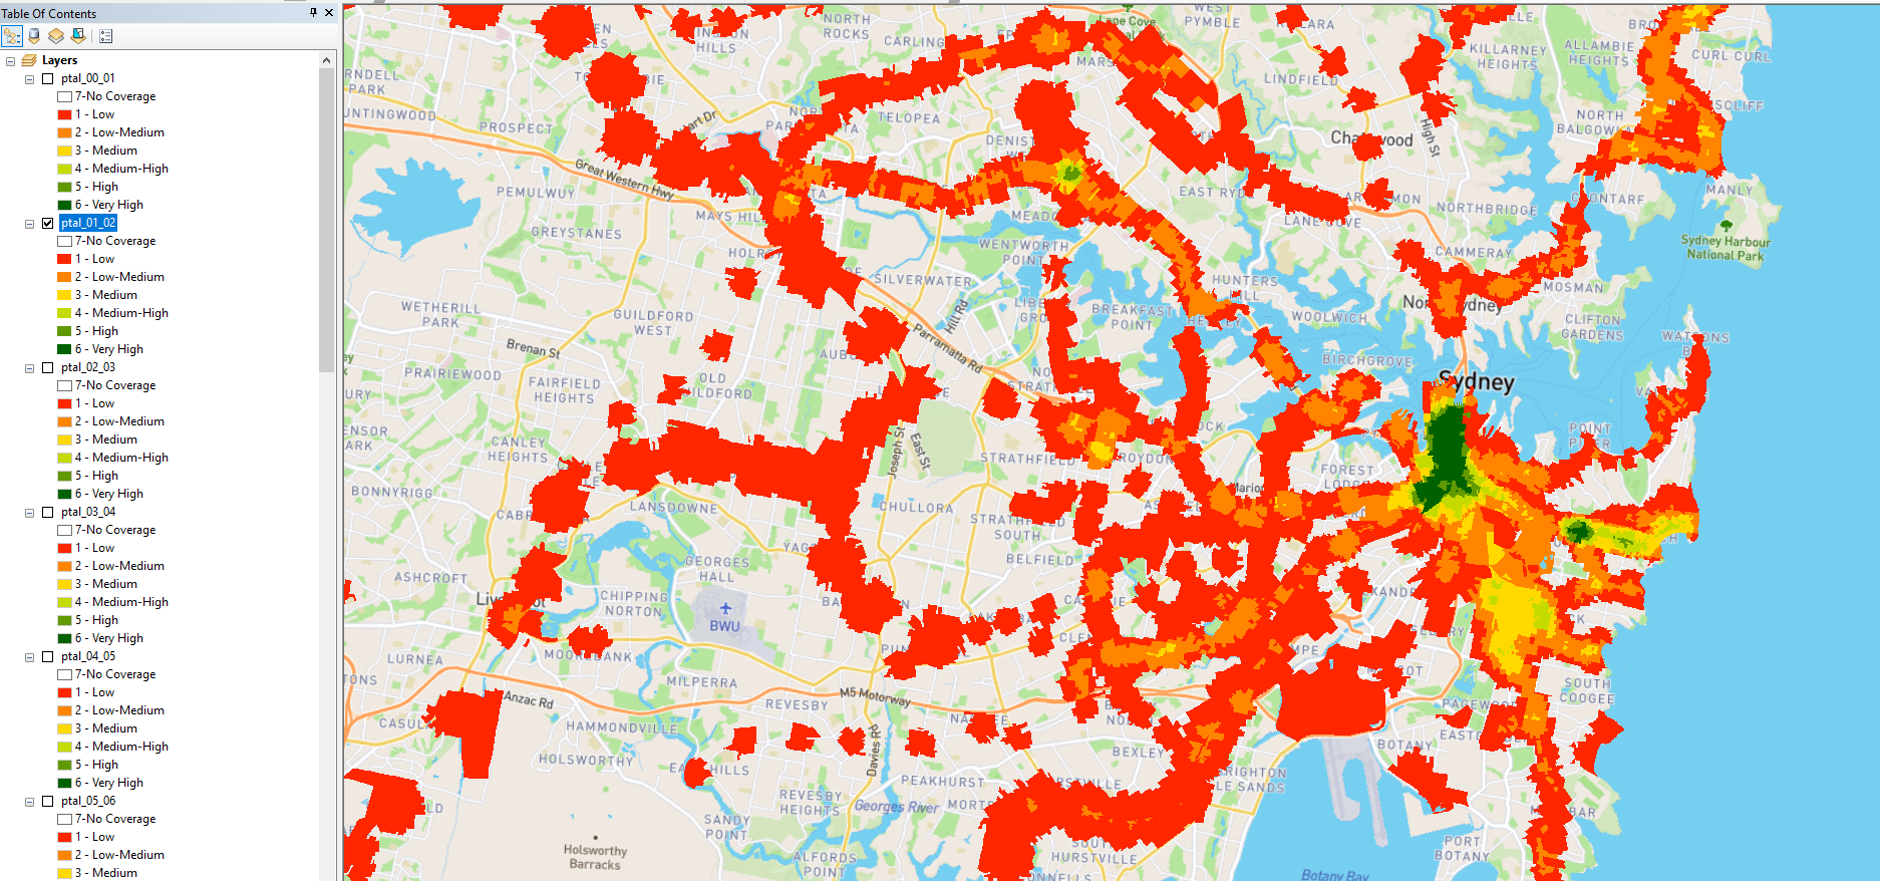32 years ago
- The purpose of the On Demand Timetables GTFS feed is to publish in advance the schedules and route information of On Demand services operated in NSW. The On Demand data feed is in the form of a General Transit Feed Specification fileset, known as ‘GTFS’, and contains extension files that conform to the proposed GTFS-Flex v2 specification. The On Demand GTFS-Flex v2 feed does not replace or supersede any of the NSW GTFS feeds, the On Demand GTFS rather provides service information specific to these On Demand services which are not included in the traditional service timetable NSW GTFS feeds.22 years ago
- This data set contains station CAD (Computer Aided Design) drawings for the station names **A - C**. The CAD drawings are 2D detailing the layout and platforms of each station. Showing train direction, station entry and exit, facilities and more. The CAD drawings were provided in 2016 so some stations could also be dated/historical in terms of data and details or **unavailable to be published.**632 years ago
- Bus lanes are sign-posted or marked as bus lanes. They are provided primarily for buses, but can also be used by: \* Taxis \* Hire cars (but not rental cars) \* Motorcycles and bicycles \* Emergency vehicles \* Special purpose vehicles and vehicles also operated by or under the direction of Roads and Maritime Services. This dataset is supplied by Transport Planning and contains all known Bus Lanes within the Greater Sydney Metro area, Newcastle and Wollongong. The data files are provided in shapefile format.22 years ago
- The Maritime Alerts Reporting Platform (MARP) API is a real-time GeoJSON feed of alerts intended for vessel operators. It includes information from both Roads and Maritime Services (RMS) and Centre for Maritime Safety (CMS). There are currently three proposed types of information to be covered by the MARP API: Marine Notices, Campaigns and Other Information.22 years ago
- This data set contains station CAD (Computer Aided Design) drawings for the station names **W - Z**. The CAD drawings are 2D detailing the layout and platforms of each station. Showing train direction, station entry and exit, facilities and more. The CAD drawings were provided in 2016 so some stations could also be dated/historical in terms of data and details or **unavailable to be published.**312 years ago
- The Australian Statistical Geography Standard (ASGS) brings together in one framework all of the regions which the Australian Bureau of Statistics (ABS) and many other organisations use to collect, release and analyse geographically classified statistics. The ASGS ensures that these statistics are comparable and geospatially integrated and provides users with a coherent set of standard regions so that they can access, visualise, analyse and understand statistics.12 years ago
- Contactless transport payments were rolled out in 2019 to all Opal-enabled buses. If you tap with your credit or debit card you now receive the same fare and travel benefits of an Adult Opal card, including the weekly travel reward, transfer discount and off peak pricing. You can also use your mobile wallet on your smartphone, tablet or wearable device that is linked to your American Express, Mastercard or Visa card. This data contains the bus regions and operators that are CTP enabled, and will be updated as new operators come on board. Note that Contract ID in this data will align with GTFS agency\_id. **Note:** from Sep 23 all STA Buses have contactless payments enabled. This dataset will no longer be updated, the list uploaded on Sep 23 is final.12 years ago
- The Toll Calculator API has been updated to Version 2 as of 16 June 2020 and provides developers a means of accessing the most up-to-date toll pricing for journeys undertaken across NSW roads. **Disclaimer:** The results returned by the Toll Calculator API are estimates only. Transport for NSW (TfNSW) does not guarantee the accuracy of the results returned by the API. Please refer to the documentation for known limitations. There are currently a number of tolled roads within the Sydney Metropolitan area. These tolls include the following road sections: * Eastern Distributor (Northbound only) - between Cahill Expressway, Woolloomooloo and Southern Cross Drive, Kensington * Hills M2 Motorway – between Lane Cove Tunnel and Westlink M7 * Lane Cove Tunnel – between Hills M2 Motorway and M1 Gore Hill Freeway * Gore Hill Freeway – between Lane Cove Tunnel and Warringah Freeway * Warringah Freeway – between Gore Hill Freeway and Bradfield Highway * New M4 Motorway – between Church Street, Parramatta and Homebush Bay Drive, Homebush * Cross City Tunnel – between Darling Harbour and Rushcutters Bay * M5 South-West Motorway - between King Georges Highway, Beverly Hills and Westlink M7 * Westlink M7 Motorway – between M2 Hills Motorway and M5 South Western Motorway * Sydney Harbour Bridge (Southbound only) * Sydney Harbour Tunnel (Southbound only) Each of the above tolled roads has different pricing systems and structures based on vehicle type, time of day, distance travelled, flat rates, flag fall and caps. This means that the total cost of a journey undertaken on multiple toll roads can be quite difficult to calculate when taking into account all of these different factors. The Toll Calculator API looks to overcome this issue while at the same time simplifying the number of parameters required to calculate the final cost. The toll rates can also be downloaded from the Toll Calculator Information dataset: [https://opendata.transport.nsw.gov.au/dataset/toll-calculator](https://opendata.transport.nsw.gov.au/dataset/toll-calculator)42 years ago
- This dataset provides counts of tap ons and tap offs made on the Opal ticketing system during two non-consecutive weeks in 2016. The Opal tap on and tap off dataset contains six CSV files covering two weeks (14 days) of Opal data across the four public transport modes. Privacy is the utmost priority for all Transport for NSW Open Data and there is no information that can identify any individual in the Open Opal Tap On and Tap Off data. This means that any data that is, or can be, linked to an individual’s Opal card has been removed. This dataset is subject to specific terms and conditions There are three CSV files per week, and these provide a privacy-protected count of taps against: 1. Time – binned to 15 minutes by tap (tap on or tap off), by date and by mode 2. Location– by tap (tap on or tap off), by date and by mode 3. Time with location – binned to 15 minutes, by tap (tap on or tap off), by date and by mode The tap on and tap off counts are not linked and individual trips cannot be derived using the data. The two weeks of Opal data are: 1. Monday 21 November 2016 – Sunday 27 November 2016 2. Monday 26 December 2016 – Sunday 1 January 2017 Release 1 files are also linked below.82 years ago
- This dataset captures the following public transport performance reports. Each resource is displayed as an interactive chart with filter options. The [TfNSW passenger travel](https://www.transport.nsw.gov.au/data-and-research/passenger-travel#Performance_reports) provides more information. * Sydney Metropolitan and Outer Metropolitan Bus Service Contract on time running results * Ferries service Reliability and On-Time Running Results * NSW Trains service reliability and punctuality results on all regional lines in New South Wales. * Sydney Trains and NSW TrainLink (Intercity) performance reports * New Customer On-Time measure – measuring our customer’s experience * Sydney Network - Historical Trains Punctuality Performance report * Performance Reporting for the Sydney Light Rail network Use the **GO TO RESOURCE** Option to view the individual reports.72 years ago
- This data is provided by TfNSW Roads and Maritime and provides live webcam vision of coastal bars and alpine waters to help boaters and skippers prepare for a safe trip. The information provided covers the location of the coastal bar, condition of the entrance and bar and any cautions that need to be taken to safely cross coastal bars. To access the link, click Go to Resource.12 years ago
- 2 years ago
- This data set contains station CAD (Computer Aided Design) drawings for the station names **M - O**. The CAD drawings are 2D detailing the layout and platforms of each station. Showing train direction, station entry and exit, facilities and more. The CAD drawings were provided in 2016 so some stations could also be dated/historical in terms of data and details or **unavailable to be published.**422 years ago
- Speed cameras are speed enforcement tools that encourage drivers to slow down and help to reduce the road toll. All speed cameras in NSW are signposted. This dataset includes location points of Fixed Speed Cameras which are used at high-risk locations or in areas with a history of severe crashes and Red Light Speed Cameras which are installed to reduce crashes at high-risk intersections with traffic lights. Mobile Speed Camera locations (street and suburb) are also provided. This dataset also identifies which speed camera location points are in school zones across NSW. Speed camera locations are also available on the Centre for Road Safety website: [https://roadsafety.transport.nsw.gov.au/speeding/speedcameras/current-lo...](https://roadsafety.transport.nsw.gov.au/speeding/speedcameras/current-locations.html)42 years ago
- This dataset provides an indicator of bus occupancy for individual bus services during three separate one week periods between August 2016 and January 2017. * Monday 8 August 2016 to Sunday 14th August 2016 * Monday 21 November 2016 – Sunday 27 November 2016 * Monday 26 December 2016 – Sunday 1 January 2017 The occupancy status is provided by three values: * STANDING ROOM ONLY * MANY SEATS AVAILABLE * FEW SEATS AVAILABLE The data is provided as zipped csv files - one per day / one per week / one for all days252 years ago
- Parking related penalty notices issued by issuing authority, financial year and offence.12 years ago
- Some Intercity trains may be longer than the platform at their destination. This dataset has detailed information on the Cars (carriages) that customers can alight from at stations on the following Intercity lines: \* Blue Mountains \* Central Coast & Newcastle \* Hunter \* South Coast \* Southern Highlands To safely exit the train you must travel in the correct car when travelling. It’s important that you check and travel in the correct car so you can exit the train at your destination. Keep in mind, Car One is always at the front of the train. This dataset captures all the Intercity Train Platforms, the maximum Cars per train, if the train aligns with the front or rear of the platform, and how many cars are off the platform for that respective station. This data is also available in GTFS-Vehicles format in the [Sydney Trains GTFS bundle](https://opendata.transport.nsw.gov.au/node/332/exploreapi#!/sydneytrains/GetSydneyTrains) Please refer to the [Sydney Trains Realtime GTFS & GTFS- R Technical Document](https://opendata.transport.nsw.gov.au/sites/default/files/Real%20Time%20Train%20Technical%20Document%20v3_2_open%20data.pdf) in order to determine the set type and number of cars for each timetabled trip.22 years ago
- This data is maintained by Transport for NSW Roads and Waterways. Boating maps are a vital tool for negotiating NSW waterways. They include handy hints for safe boating. This dataset provides Boating maps for the following areas: \* North Coast maps \* Hunter Inland maps \* Hawkesbury River/Broken Bay maps \* Sydney maps \* South Coast maps \* Murray Inland maps \* Coastal maps \* Australian Capital Territory maps You will find the map number, area and date it was last update. The maps capture, restricted waters, navigation aids, restricted activities and cautions, boating facilities and general information. Click on Go to Resource to access the website.12 years ago
- This dataset contains patronage statistics for all intrastate air services to and from Sydney airport. This data is collected quarterly under the Air Transport Regulation 2016. The patronage data dates back to 1996/97.32 years ago
- Create your own personal public transport trip planner. APIs interact with the transportnsw.info trip planner and provide the ability for NSW public transport trip planning, departure board, travel alerts, real-time transport services and walk and drive legs. Trip Planner API to interact with the Transport for NSW trip planner. This allows users to search for trips, stops, service alerts, places of interest. The Trip Planner API offers five different endpoints: Stop Finder, Trip Planner, Departure, Service Alerts and Coordinate Request APIs. You can find more information about each of these below. Before you start using the API, we encourage you to read all available documentation at [https://opendata.transport.nsw.gov.au/documentation#9](https://opendata.transport.nsw.gov.au/documentation#9) For tips and tricks please visit our Troubleshooting page at [https://opendata.transport.nsw.gov.au/troubleshooting](https://opendata.transport.nsw.gov.au/troubleshooting)32 years ago
- This dataset contains the propensity index for cycling across different areas. It also contains the report that examines spatial relationship between areas with high propensity for cycling with high concentrations of short distance car trips.22 years ago
- Throughout NSW there are buses that run within and between regional centres and towns, the fares for these buses are calculated based on the Fare Band and Number of sections travelled. This dataset provides the regional bus fares for each fare band and section, what the maximum adult single trip fare is and the corresponding adult daily ticket for the fare band and section. Bus operators may choose to set fares below these limits. Eligible concession holders will pay half the adult fare. Eligible concession card holders can access discounted bus fares in regional New South Wales with a [Regional Excursion Daily (RED) ticket](https://transportnsw.info/tickets-opal/regional-tickets-fares/regional-bus-tickets-fares#accordion-regional-excursion-daily-red-tickets-content). The RED ticket provides unlimited local daily bus travel for just $2.50. **The RED ticket is not valid on NSW TrainLink train or coach services.** For Timetables and route maps visit [Transport NSW](https://transportnsw.info/tickets-opal/regional-tickets-fares/regional-bus-tickets-fares).12 years ago
- This dataset contains GTFS timetables for autonomous vehicles in NSW.12 years ago
- Peak train load estimates use data extracted from the Rail Opal Assignment Model (ROAM). This model assigns Opal journeys to services based on the rail daily working timetable and train punctuality data. The customer load is aggregated to train services and assigned to rail lines.92 years ago
- NSW is home to a number of wonderful road trips. They wind along coastlines, through beautiful valleys and amazing rainforests, and down dusty outback roads. A few of the many road trips in NSW are: \* The Greater Blue Mountains \* Kosciuszko Alpine Way \* Grand Pacific Drive \* Mighty Murray River Drive \* Central to Outback NSW \* Darling River Run To help drivers navigate their way around the these great road trips, tourist signs are posted in NSW and have a white legend on a brown background and serve to: \* Indicate to drivers & riders features or places that are major tourist attractions. \* Detail the routes of themed or regional tourist drives. \* Welcome visitors to the state and its tourism regions. This dataset includes the geospatial files of the road segments which are considered to be "tourist roads" in the TfNSW datastore.22 years ago
- This dataset contains a snapshot of commuting patterns for Census day 2011 (Tuesday 9th August). It is a complete enumeration via a self-completion Census form. The scope of Journey to Work (JTW) 2011 is employed persons aged 15 years and over, who were employed the week before Census night, and with a workplace in NSW. Journey to Work data may produce slightly different counts to those obtained directly from the Australian Bureau of Statistics (ABS) for the same geographic level due to: * ABS confidentialising process is applied to the data that Transport Performance and Analytics (TPA) purchases (randomisation of small cells) * Further validation and adjustment of the data undertaken by Transport Performance and Analytics TPA * Imputation of records of incomplete addresses to eliminate locality ‘dump’ codes ABS data is used with permission from the Australian Bureau of Statistics352 years ago
- This dataset contains a snapshot of commuting patterns for Census day 2006 (Tuesday 8th August). It is a complete enumeration via a self-completion Census form. The scope of Journey to Work (JTW) 2006 is employed persons aged 15 years and over, who were employed the week before Census night, and with a workplace in NSW. JTW data may produce slightly different counts to those obtained directly from the Australian Bureau of Statistics (ABS) for the same geographic level due to: * ABS confidentialising process is applied to the data that Transport Performance and Analytics (TPA) purchases (randomisation of small cells) * Further validation and adjustment of the data undertaken by Transport Performance and Analytics TPA * Imputation of records of incomplete addresses to eliminate locality ‘dump’ codes ABS data is used with permission from the Australian Bureau of Statistics232 years ago
- “Physical Distancing Capacity” levels have varied through different levels of restrictions due to different physical distancing advisory. This dataset contains two resources documenting historical physical distancing capacity levels and corresponding occupancy statuses. A more detailed description for each resource is provided below. These two resources are related but not completely consistent due to different practical implementation constraints.22 years ago
- This is a link to the NSW Toll Road Data website. The datasets on this website contain traffic data for the following toll roads in Sydney, New South Wales, Australia that are wholly or partly owned by Transurban: * Cross City Tunnel (CCT) * Hills M2 (M2) * Lane Cove Tunnel/Military Road E-Ramp (LCT) * M1 Eastern Distributor (ED) * M4 (M4) * M5 South West Motorway (M5) * M5East & M8 (M5E) * NorthConnex (NCX) * Westlink M7 (M7) Data available is grouped by quarter for each year starting 2009.12 years ago
- This data is maintained by the Spatial Services Spatial Data Services. If you have any questions with regards to this dataset, please contact [SS-SDS@customerservice.nsw.gov.au](mailto:SS-SDS@customerservice.nsw.gov.au) The NSW Points of Interest (POI) web service allows users to search for and identify the location of features that people may want to see on a map, know about or visit. POI features are derived from features maintained within multiple themes of the NSW Foundation Data Framework (FSDF). The features included in the NSW POI web service are: community, education, medical, recreation, transportation, utility, hydrography, physiography and place. Click on "Go to Resource" to view the data source.12 years ago
- Macquarie University and the City of Ryde Council installed pedestrian-counting sensors throughout Macquarie Park, as part of a project to ease congestion in the growing education, residential, retail and business hub. The pedestrian counters monitored pedestrian flow and blockages, and the data will be used to improve safety and connectivity to transport services. Historical transport, parking and pedestrian data are consolidated on an open-source platform to inform planners and local businesses across Macquarie Park. A dashboard to view the data can be found at [http://smartcity-api.science.mq.edu.au/](http://smartcity-api.science.mq.edu.au/) The raw data that makes up the dashboard is available below.192 years ago
- This dataset contains the various parking and council related data that has been made available on the Open Data Hub. It covers parking related penalty notices, the location of Sydney CBD kerbside loading zones, the Car Park API which provides real time occupancy status of selected car parks, Waverley council data and more! Note: Some of these data sets are provided by and maintained by the City of Sydney. * [Smart Cities Macquarie Park](https://opendata.transport.nsw.gov.au/dataset/smart-cities-macquarie-park) * [Smart Pedestrian Project Liverpool Council](https://opendata.transport.nsw.gov.au/dataset/smart-pedestrian-project) * [Waverley Council Data](https://opendata.transport.nsw.gov.au/dataset/waverley-council-data) * [Willoughby Street Parking Signs](https://opendata.transport.nsw.gov.au/dataset/willoughby-street-parking-signs) * [Mobility Parking](https://opendata.transport.nsw.gov.au/dataset/mobility-parking) * [Car Park API](https://opendata.transport.nsw.gov.au/dataset/car-park-api) * [Parking Space Levy Assessments](https://opendata.transport.nsw.gov.au/dataset/parking-space-levy-assessments) * [Penalty Notices](https://opendata.transport.nsw.gov.au/dataset/penalty-notices) * [Parking Offences](https://opendata.transport.nsw.gov.au/dataset/parking-offences) * [Parking Permits, Meters and Rates](https://opendata.transport.nsw.gov.au/dataset/parking-permits-meters-and-rates) * [Loading Zones Kerbside](https://opendata.transport.nsw.gov.au/dataset/loading-zones-kerbside) * [Off-street Parking](https://opendata.transport.nsw.gov.au/dataset/off-street-parking) * [Car Share Bays](https://opendata.transport.nsw.gov.au/dataset/car-share-bays)02 years ago
- The dataset captures Disability Standards for Accessible Public Transport compliance at railway stations and wharves across NSW. In the first release, files in csv format, contains site audit or consolidation exercise data for Lifts at railway stations. Additional data includes TSN, location description, latitude/longitude, and asset ID that matches to Sydney Trains Lift ID. There will be a gradual roll out of other transit stop elements such as accessible car parks, accessible and ambulant toilets, lifts, pedestrian crossings, platforms, retail spaces and ticket machines. Disclaimers: (1) The field ‘is\_this\_a\_consolidation\_exercise\_or\_a\_site\_audit’ indicates how the data is obtained. Data from a consolidation exercise (desktop audit) is not as accurate as a site audit. (2) The data reflects a point in time and may not reflect works that have been completed since the ‘updated\_at’ date.22 years ago
- The dataset is provided in good faith by Waverley Council in an effort to promote a range of mobility options for visitors to the Waverley Local Government Area. There are a range of transport, parking and accessibility data provided.252 years ago
- This dataset includes the open data sets we have about cycling and bicycle counts and includes the following data: * **[Popup Cycleway](https://opendata.transport.nsw.gov.au/dataset/pop-cycleway)** The Popup Cycleway data includes six popup cycleways in key commuter areas across the city to promote walking and cycling. It's part of a set of initiatives developed across the Sydney region to provide people more options to safely walk, cycle and commute to work in 2020. More cycleway (bike paths) data can be referenced from the [Cycleway Finder](https://www.rms.nsw.gov.au/maps/cycleway_finder) and [Open Street Map](https://www.openstreetmap.org/#map=4/-28.15/133.28). * **[Cycling count](https://opendata.transport.nsw.gov.au/dataset/cycling-count)** The Cycling count data contains the data for different local government area (LGA). The City of Sydney has conducted twice yearly intersection cycle counts at various sites in peak hours (6-9 am and 4-7 pm) on one day in March and October every year, since March 2010 (excluding March 2018). This data is consolidated to provide a total number of cyclists at the site during peak hours. * **[Cycleway Data](https://opendata.transport.nsw.gov.au/dataset/cycleway-data)** The Cycleway infrastructure data is a database of the cycleway infrastructure located throughout NSW and maintained by Roads and Maritime Services (RMS). * **[Active Transport: Cycling](https://opendata.transport.nsw.gov.au/dataset/active-transport-cycling)** The information featured here include data from the Sydney Cycling Survey (SCS). The SCS surveys over 11,000 individuals from 4,000 households. It collects information about cyclists, cycling trips, cycling participation and cycling mode share. Publications about cycling using data from the Household Travel Survey, Census of Population and Housing, and bicycle counters are also available. * **[Cycle Network - City of Sydney](https://opendata.transport.nsw.gov.au/dataset/cycle-network-city-sydney)** Existing, rideable bicycle routes through the City of Sydney local government area for bicycle commuters. For more information visit [City of Sydney](https://data.cityofsydney.nsw.gov.au/search). * **[Cycling Propensity](https://opendata.transport.nsw.gov.au/dataset/cycling-propensity)** This dataset contains the propensity index for cycling across different areas. It also contains the report that examines spatial relationship between areas with high propensity for cycling with high concentrations of short distance car trips.02 years ago
- GIPA request: "The number and value of speeding fines issued by fixed digital speed cameras and by NSW Police, according to the offender’s postcode, for calendar years 2014 and 2015. Please provide a list of the top 10 highest speeds recorded on speed cameras for calendar years 2014 and 2015, along with the postcode, age, gender of offender and how far over the limit they were going. "12 years ago
- Commuter car parking facilities are located close to many public transport hubs throughout NSW, and help you to connect easily to Metro, Train, Bus and Ferry services. This dataset captures the location of the current and proposed locations of the various commuter car parks in NSW. It shows the number of standard, accessible and motorcycle spaces at each location. * Standard CCP (Commuter Car Park) spaces refer to your standard length and are available for the everyday car user. * Accessible Commuter Car Park spaces are designated car spaces for users with a accessibility parking permit only. * Motorcycle spaces are designated spaces for motorcycle parking only. * 2017-2020 changes shows how many spaces were added or removed in each location (where applicable). * Planned/Future spaces shows how many standard Commuter Car Park and accessible Commuter Car Park spaces are planned for each location, but yet to have a confirmed implementation date.12 years ago
- **A new Road Numbering System** The NSW Government has made significant improvement to how motorists can find their way across NSW. Transport for NSW has implemented a new system of alpha-numeric route numbering. This dataset provides you with the important changes to NSW, and additional information regarding the program. **Route numbers and road names** The existing 'shield' route markers have been replaced with a combination of a letter - either an M (motorway), A (route of national significance) or B (route of state significance) - and a number from 1 to 99. **NSW Route Number Map** 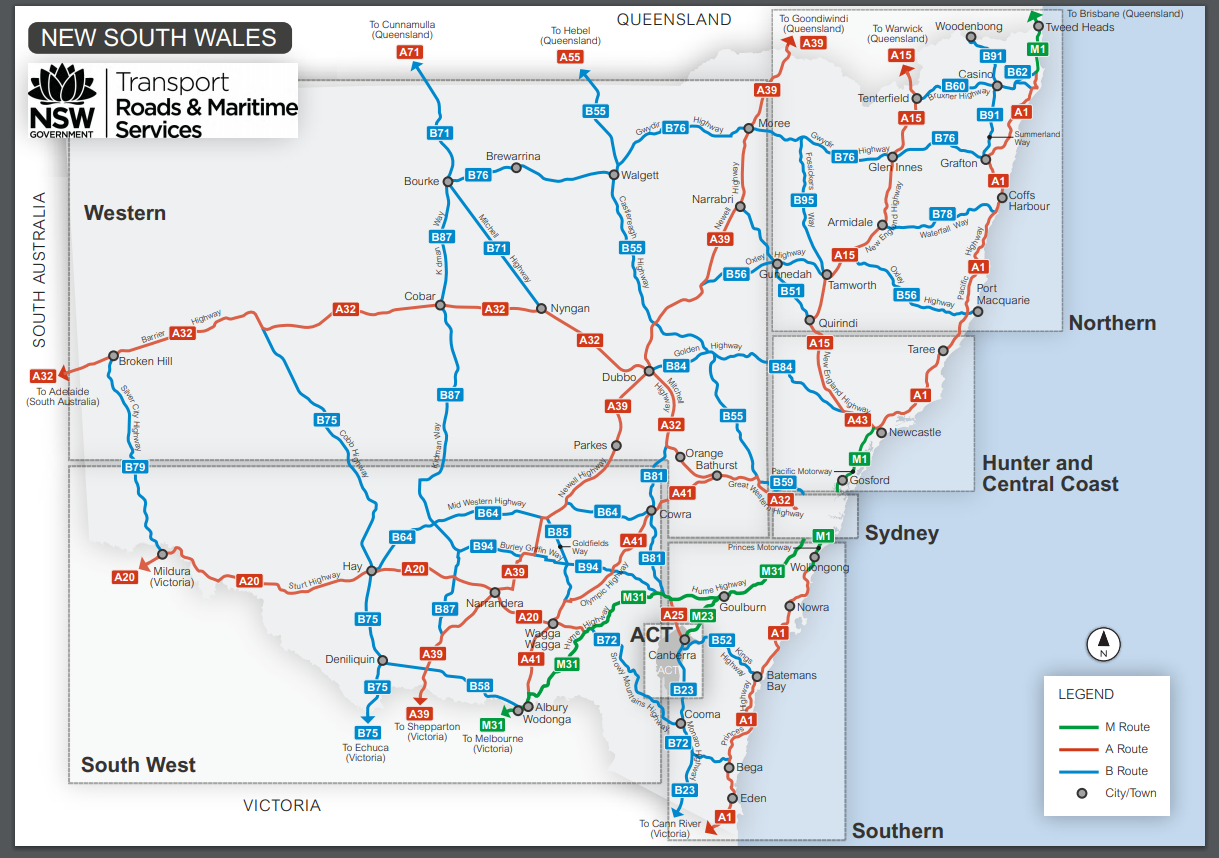42 years ago
- Between Nov 2014 and Nov 2015, Transport for NSW conducted three surveys to measure customer satisfaction levels across the NSW public transport system. This dataset provides the results of the surveys.22 years ago
- Air pollution has a significant impact on human health and the economy. Air quality in Sydney is usually very good by international standards. For more information about air quality in Sydney, how our ventilation systems work to manage air quality within and outside the tunnels, and what has contributed to improve vehicle emissions visit the [Air Quality Portal](https://v2.communityanalytics.com.au/rms/air-quality/#). This dataset provides standardised measures of: * Carbon Monoxide * Nitrogen dioxide * Nitrogen oxides * Ozone * Sulfur dioxide * Particles < 10μm diameter * Particles < 2.5μm diameter * BTEX * Methane * Non-Methane Hydrocarbons * THC The data captured is from 01/01/2004 - 31/12/2017 and only includes sites where RMS had access to the monitor's data. More information about the sites covered can be found in the Report and associated data files.152 years ago
- This dataset contains a snapshot of commuting patterns for Census day 1991 (Tuesday 6th August). It is a complete enumeration via a self-completion Census form. The scope of JTW is employed persons aged 15 years and over, who were employed during the week before Census night, and resident in the Greater Metropolitan Area (GMA) JTW data may produce slightly different counts to those obtained directly from the Australian Bureau of Statistics (ABS) for the same geographic level due to: * ABS confidentialising process is applied to the data that TPA purchases (randomisation of small cells) * Further validation and adjustment of the data undertaken by TPA * Imputation of records of incomplete addresses to eliminate locality ‘dump’ codes ABS data is used with permission from the Australian Bureau of Statistics262 years ago
- The Open Data Hub has numerous data relating to roads and speed, whether it be the Sydney Region Carriageway, the Tolls on our NSW roads, or the speed zones and speed camera locations. Below you will find a full list of available data sets; * [NorthConnex](https://opendata.transport.nsw.gov.au/dataset/northconnex) * [Sydney Region Carriageway](https://opendata.transport.nsw.gov.au/dataset/sydney-region-carriageway) * [Road Segment Data from Data.NSW](https://opendata.transport.nsw.gov.au/dataset/road-segment-data-from-datansw) * [NSW Speed Cameras](https://opendata.transport.nsw.gov.au/dataset/nsw-speed-cameras) * [Speed Zones](https://opendata.transport.nsw.gov.au/dataset/speed-zones) * [NSW Toll Road Data](https://opendata.transport.nsw.gov.au/dataset/nsw-toll-road-data) * [NSW Rest Areas](https://opendata.transport.nsw.gov.au/dataset/nsw-rest-areas) * [Toll Calculator API](https://opendata.transport.nsw.gov.au/dataset/toll-calculator-api) * [Toll Calculator](https://opendata.transport.nsw.gov.au/dataset/toll-calculator) * [Historic Roads Travel Time Data (TTDS)](https://opendata.transport.nsw.gov.au/dataset/historic-roads-travel-time-data-ttds) * [NSW Roads Traffic Volume Counts API](https://opendata.transport.nsw.gov.au/dataset/nsw-roads-traffic-volume-counts-api) * [Data on the speeding fines issued by the speeding cameras and NSW Police](https://opendata.transport.nsw.gov.au/dataset/data-on-speeding-fines-issued-speeding-cameras-and-nsw-police) * [Data on the speeding fines by the offender's postcode](https://opendata.transport.nsw.gov.au/dataset/data-on-speeding-fines-offender%E2%80%99s-postcode) * [Traffic Lights Location](https://opendata.transport.nsw.gov.au/dataset/traffic-lights-location) * [Penalty Offences](https://opendata.transport.nsw.gov.au/dataset/penalty-notices) * [NSW Clearways](https://opendata.transport.nsw.gov.au/dataset/nsw-clearways) * [Live Traffic Site Status](https://opendata.transport.nsw.gov.au/dataset/live-traffic-site-status) * [Live Traffic Hazards](https://opendata.transport.nsw.gov.au/dataset/live-traffic-hazards) * [Live Traffic Cameras](https://opendata.transport.nsw.gov.au/dataset/live-traffic-cameras)02 years ago
- Realtime alerts at either the stop, trip, or service line level in GTFS-realtime format for Bus, Train, Ferry, Light Rail, Metro and Coaches.12 years ago
- Travel time data is collected in real-time from commercial vehicles and has been provided in this dataset for four separate weeks in 2016 and for two months in 2017. **2016 TTDS Data:** \* Monday 25 July 2016 - Sunday 31 July 2016 \* Monday 8 August to Sunday 14th August 2016 \* Monday 21 November 2016 – Sunday 27 November 2016 \* Monday 26 December 2016 – Sunday 1 January 2017 (school holidays and New Year’s Eve) **2017 TTDS Data:** \* September 2017 \* October 2017 Please refer to the Roads Realtime data which provides the same underlying data as the Road Travel Time data presented here. The fields for this data set include the Position Time, the GPS location, the Bearing in degrees, the speed in KPH and the Speed Limit for that section.22 years ago
- The ABS released the following set of experimental electric vehicle estimates on Friday 26th November 2021. These estimates were derived from a small sample of electric passenger vehicles selected in each state and territory as part of the 2019-20 Survey of Motor Vehicle Use (SMVU). This sample of electric passenger vehicles were surveyed using a subset of SMVU questions relating to distance travelled.12 years ago
- Incidents, Fires, Floods, Alpine Conditions, Major Events and Roadworks information including GPS coordinates in GeoJSON format12 years ago
- Released under formal Government Information Public Access (GIPA) Application to Department of Finance, Services and Innovation (DFSI) - FA#99 15-16 For each year of the 1.) 2013, 2.) 2014 and 3.) 2015 years, please provide the following: The total number of infringements issued for offences on Sydney Trains services and property along with their description and date and infringement amount. The infringements will include fare evasion, feet on seats, littering, smoking and other forms of anti-social conduct.12 years ago
- This data is provided by the City of Sydney and provides bus shelter locations. There are 40 public bus shelters controlled by the City of Sydney. The API provides data in GeoJSON format, for more information visit [City of Sydney](https://data.cityofsydney.nsw.gov.au/datasets/bus-shelters).12 years ago
- The NSW Taxi Council is the peak body for the NSW Taxi Industry. It represents taxi networks, owners and operators. This dataset includes location points of the Taxi Ranks in the Sydney Metro area including 15 of the 23 Secure Taxi Ranks. Secure taxi ranks operate late on Friday and Saturday nights in busy locations across NSW. Security guards are on duty to help ensure a safe environment for both customers and drivers. The dataset is as at 31/10/2018, and includes decommissioned Taxi Ranks due to the implementation of the L2 and L3 Light Rail infrastructure and various Pop Up Cycleways, and is missing newly implemented Secure taxi ranks.12 years ago
- This dataset provides counts of tap ons and tap offs made on the Opal ticketing system during two non-consecutive weeks in 2016. The Opal tap on and tap off dataset contains six CSV files covering two weeks (14 days) of Opal data across the four public transport modes. Privacy is the utmost priority for all Transport for NSW Open Data and there is no information that can identify any individual in the Open Opal Tap On and Tap Off data. This means that any data that is, or can be, linked to an individual’s Opal card has been removed. **This dataset is subject to specific** [terms and conditions](https://opendata.transport.nsw.gov.au/sites/default/files/Opal%20Data%20Terms%20and%20Conditions%20v1.pdf) There are three CSV files per week, and these provide a privacy-protected count of taps against: 1. Time – binned to 15 minutes by tap (tap on or tap off), by date and by mode 2. Location– by tap (tap on or tap off), by date and by mode 3. Time with location – binned to 15 minutes, by tap (tap on or tap off), by date and by mode The tap on and tap off counts are not linked and individual trips cannot be derived using the data. The two weeks of Opal data are: 1. 25 July to 31 July 2016 (before paper ticket retirement – paper ticket data is not included in the dataset) 2. 8 August to 14 August 2016 (after paper ticket retirement).112 years ago
- This dataset contains a spreadsheet with public transport alert information for June to December 2017.12 years ago
- The historical traffic API provides historical data on NSW incidents. [Live Traffic NSW](https://www.livetraffic.com/historical-data-search) allows you to search for a particular date and location.22 years ago
- This dataset provides an indicator of train occupancy for individual train services from November 2018 to February 2019. The occupancy status is provided at each train station per train service per day. Occupancy <65% train capacity : MANY\_SEATS\_AVAILABLE Occupancy >= 65% train capacity : FEW\_SEATS\_AVAILABLE Occupancy >= 105% train capacity : STANDING\_ROOM\_ONLY This dataset is used at Transport for NSW for planning purposes. To note: • Train services between Midnight and 1.30 am are not in the dataset • There are services with no occupancy status, as the train service type (train capacity) was not available42 years ago
- This dataset contains selected train stations that have been mapped in accordance with GTFS Pathways format: [https://developers.google.com/transit/gtfs/reference#pathwaystxt](https://developers.google.com/transit/gtfs/reference#pathwaystxt) This data - in combination with other TfNSW GTFS datasets - can be used to give users step by step navigational guidance between station entrances and platforms. This includes estimated traversal time, signposts, and pathway accessibility.22 years ago
- This dataset contains a list of every entrance for every station in NSW. The data includes street name, street type, entrance type, location (latitude and longitude) of the entrance and exit number (if applicable).32 years ago
- This dataset contains the cycling count data for different local government area (LGA).32 years ago
- This dataset contains the translation (or transliteration) of every station or wharf in the Transport for NSW network in 12 languages: * Arabic * French * German * Greek * Hindi * Italian * Japanese * Korean * Simplified Chinese * Spanish * Traditional Chinese * Vietnamese Each Excel file captures the TSN (Transit Stop Number), Station name in English, Suburb name in English, and the individual language translation. Our preference is for the translated/transliterated version of the station/wharf name to be displayed with the official English station/wharf name for a better customer experience.122 years ago
- Thank you for your interest in Journey to Work data. Due to changes implemented by the ABS to confidentialise Census 2016 data and protect individuals from re-identification, TPA is not able to release JTW 2016 with TZ spatial variables. If you have downloaded JTW 2016 data with TZ spatial variables from this site, please delete it. TPA does not recommend it’s use. If you require further assistance or clarification, please email [OpenDataHelp@transport.nsw.gov.au](http://OpenDataHelp@transport.nsw.gov.au). JTW 2016 is available to download via the ABS website: [https://auth.censusdata.abs.gov.au/webapi/jsf/login.xhtml](https://auth.censusdata.abs.gov.au/webapi/jsf/login.xhtml). Please note, in releasing JTW 2016 the ABS has removed additivity and supressed all values smaller than 3.02 years ago
- This data is provided by the City of Sydney and provides bicycle parking locations. There are more than 3000 public bike parking spaces in the City of Sydney's area. There are 32 free bicycle parking spaces at Kings Cross car park level 5. Goulburn Street car park has 9 individual bike cages for casual use, as well as a free secure cage with 24 spaces that can be accessed with a pass. The API provides data in GeoJSON format, for more information visit [City of Sydney](https://data.cityofsydney.nsw.gov.au/datasets/bicycle-parking-1?geometry=150.877%2C-33.938%2C151.531%2C-33.838).32 years ago
- The Regional Day Return indicator is a measure of regional centre connectivity under the [Future Transport Strategy](https://future.transport.nsw.gov.au/plans/regional-nsw-services-and-infrastructure-plan/customer-outcomes-for-regional-nsw). It aims to provide new connections for regional communities for commuting, attending medical or business appointments, shopping, recreational activities and visiting family and friends. Below is an example of the Regional Day Return indicator catchments 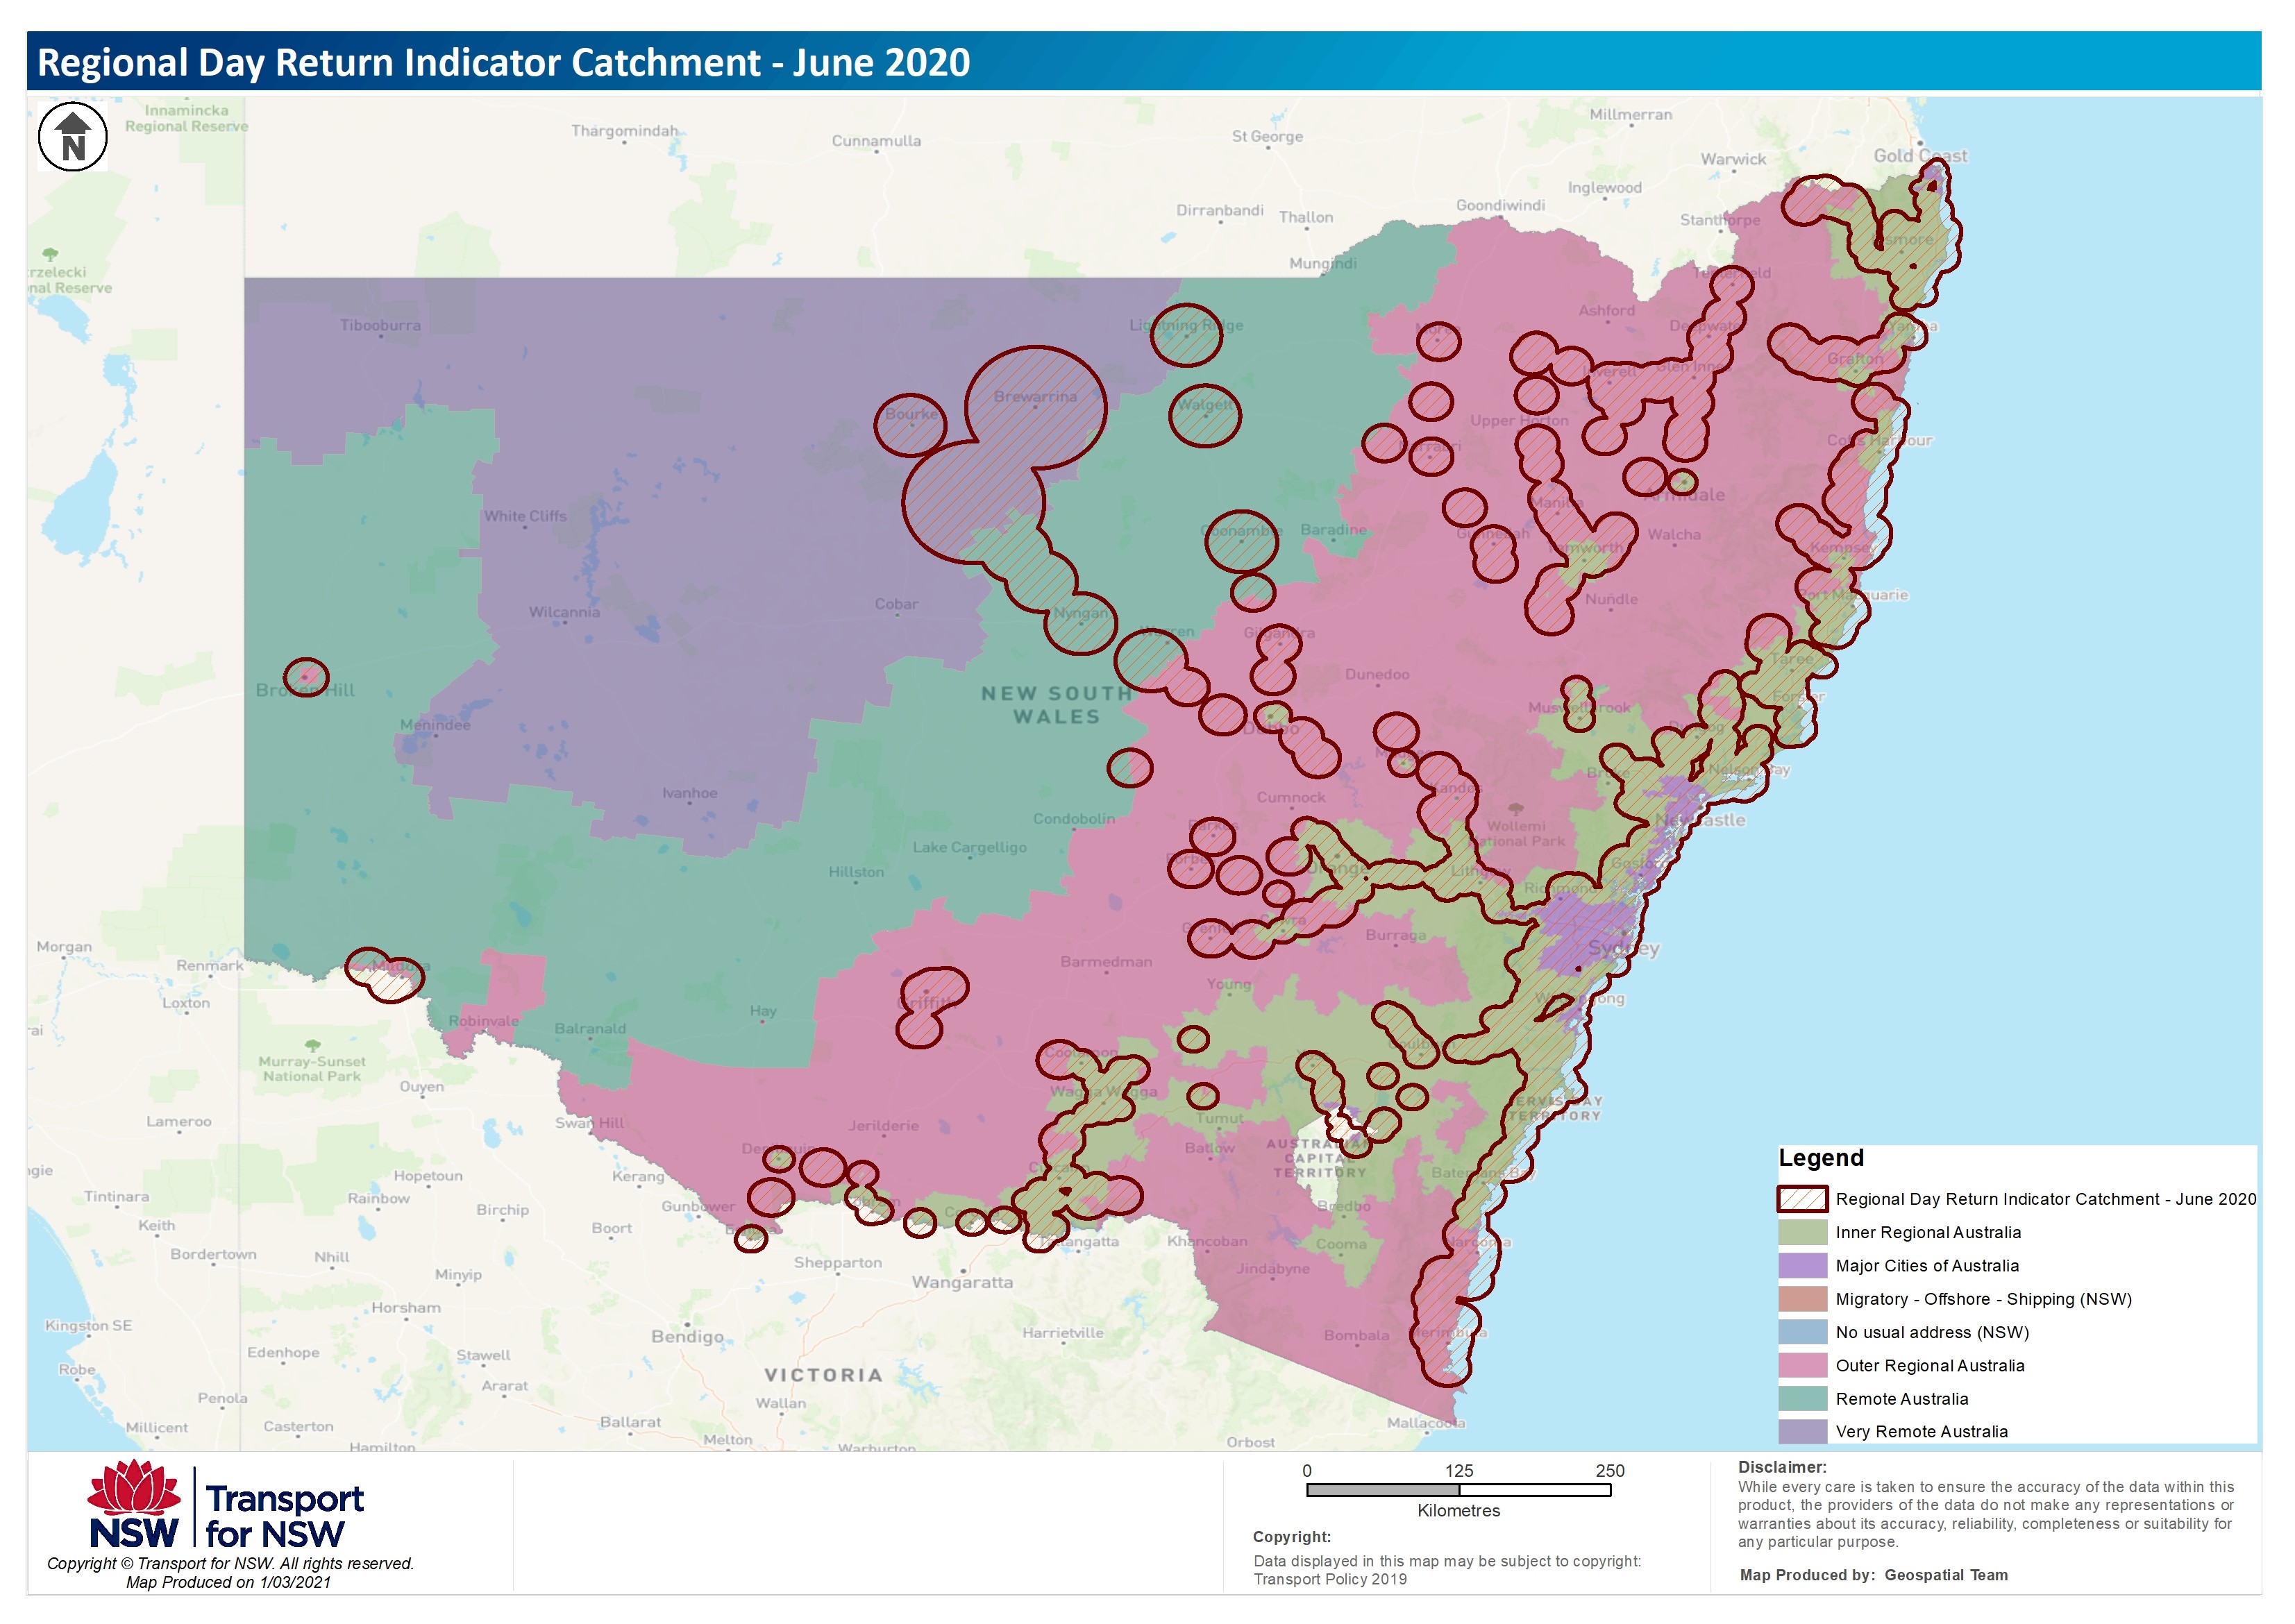 For more information about the trials, the process and datasets used please refer to the Regional Day Return Indicator document.22 years ago
- This data is part of the strategic transport modelling undertaken for Urban Transport Crowding and Congestion, a supplementary report of the Australian Infrastructure Audit 2019. The report looks at historical data from 2016, and also provides a projection of what crowding on buses and suburban trains could look like in 2031, if infrastructure investment do not keep up with the pace of demand. [Network performance in Sydney, the Hunter and Illawarra](https://www.infrastructureaustralia.gov.au/urban-crowding-congestion-maps-sydney-network) showcases their findings as interactive maps. The following resources are available, links will be provided that lead you directly to the current source of data. **Crowding on buses** \* Crowding on buses during 2016 AM peak \* Crowding on buses (projected) during 2031 AM peak \* Crowding on buses during 2016 PM peak \* Crowding on buses (projected) during 2031 PM peak **Crowding on suburban trains** \* Crowding on suburban trains during 2016 AM peak \* Crowding on suburban trains (projected) during 2031 AM peak \* Crowding on suburban trains during 2016 PM peak \* Crowding on suburban trains (projected) during 2031 PM peak82 years ago
- This API provides real time kerbside parking occupancy for selected councils in Sydney. Notification will be sent at regular intervals each time parking becomes vacant/occupied, this data will be transformed & consolidated to standardised format and published in Open Data to provide real time parking occupancy.22 years ago
- This data is part of the strategic transport modelling undertaken for Urban Transport Crowding and Congestion, a supplementary report of the Australian Infrastructure Audit 2019. The report looks at historical data from 2016, and also provides a projection of what access to jobs and services in Sydney, the Hunter and Illawarra could look like in 2031, if infrastructure investment do not keep up with the pace of demand. [Network performance in Sydney, the Hunter and Illawarra](https://www.infrastructureaustralia.gov.au/urban-crowding-congestion-maps-sydney-access) showcases their findings as interactive maps. The following resources are available, links will be provided that lead you directly to the current source of data. \* Access to jobs by car within 30 minutes \* Access to jobs by public transport within 30 minutes \* Access to hospitals62 years ago
- This dataset provides an indicator of train occupancy for individual train services from November 2016 to February 2017. The occupancy status is provided at each train station per train service per day. Occupancy <65% train capacity : MANY\_SEATS\_AVAILABLE Occupancy >= 65% train capacity : FEW\_SEATS\_AVAILABLE Occupancy >= 105% train capacity : STANDING\_ROOM\_ONLY This dataset is used at Transport for NSW for planning purposes. To note: • Train services between Midnight and 1.30 am are not in the dataset • There are services with no occupancy status, as the train service type (train capacity) was not available102 years ago
- This data is part of the strategic transport modelling undertaken for Outer Urban Public Transport Maps, which was released in October 2018. The [Outer Urban Public Transport Maps](https://www.infrastructureaustralia.gov.au/outer-urban-public-transport-maps-sydney) showcases through interactive maps, the comparative public transport network performance for Greater Sydney. The following resources are available, links have been provided that direct you to the current source of data. **Walking access to medium- to high-frequency public transport** This layer presents the proportion of people within walking distance to high-medium frequency public transport stops/stations in 2017. Walking distance is defined as 800 metres for heavy rail, and 400 metres for all other modes. High-frequency public transport is defined as having at least four services per hour during AM peak. This analysis was performed using 2017 timetables. **Public transport travel times to Sydney CBD** This layer presents travel times, by public transport during AM peak, to a series of destinations. This analysis was performed using 2017 public transport timetables. The layers represents the geographical extent of the inner, middle, and outer sectors used to perform the analysis in the report. **Public transport service frequency** This layer presents public transport stop frequency during weekday AM peak (8-9am) and weekday off peak (11am-12am). This analysis was performed using 2017 public transport timetables.62 years ago
- 2 years ago
- Private mooring licences are only issued to individuals. They’re not issued to a partnership, company, organisation or association. A private mooring licence permits you to moor your vessel on navigable waters. The licence is valid for 12 months. It will be renewed on payment of your annual [private mooring fees](https://www.rms.nsw.gov.au/maritime/moorings/mooring-fees.html#Privatemooringfees). The [RMS Private Moorings](https://www.rms.nsw.gov.au/maritime/moorings/private-moorings/index.html#Findingasuitablemooring) provides additional information regards: \* What is a private mooring licence? \* Finding a suitable mooring \* Applying for a mooring \* Joining a priority wait list Looking for a private mooring in NSW? Use this [map](https://www.rms.nsw.gov.au/maritime/moorings/private-moorings/map/#/cartomap) to find available and priority wait list areas, and to submit your application. 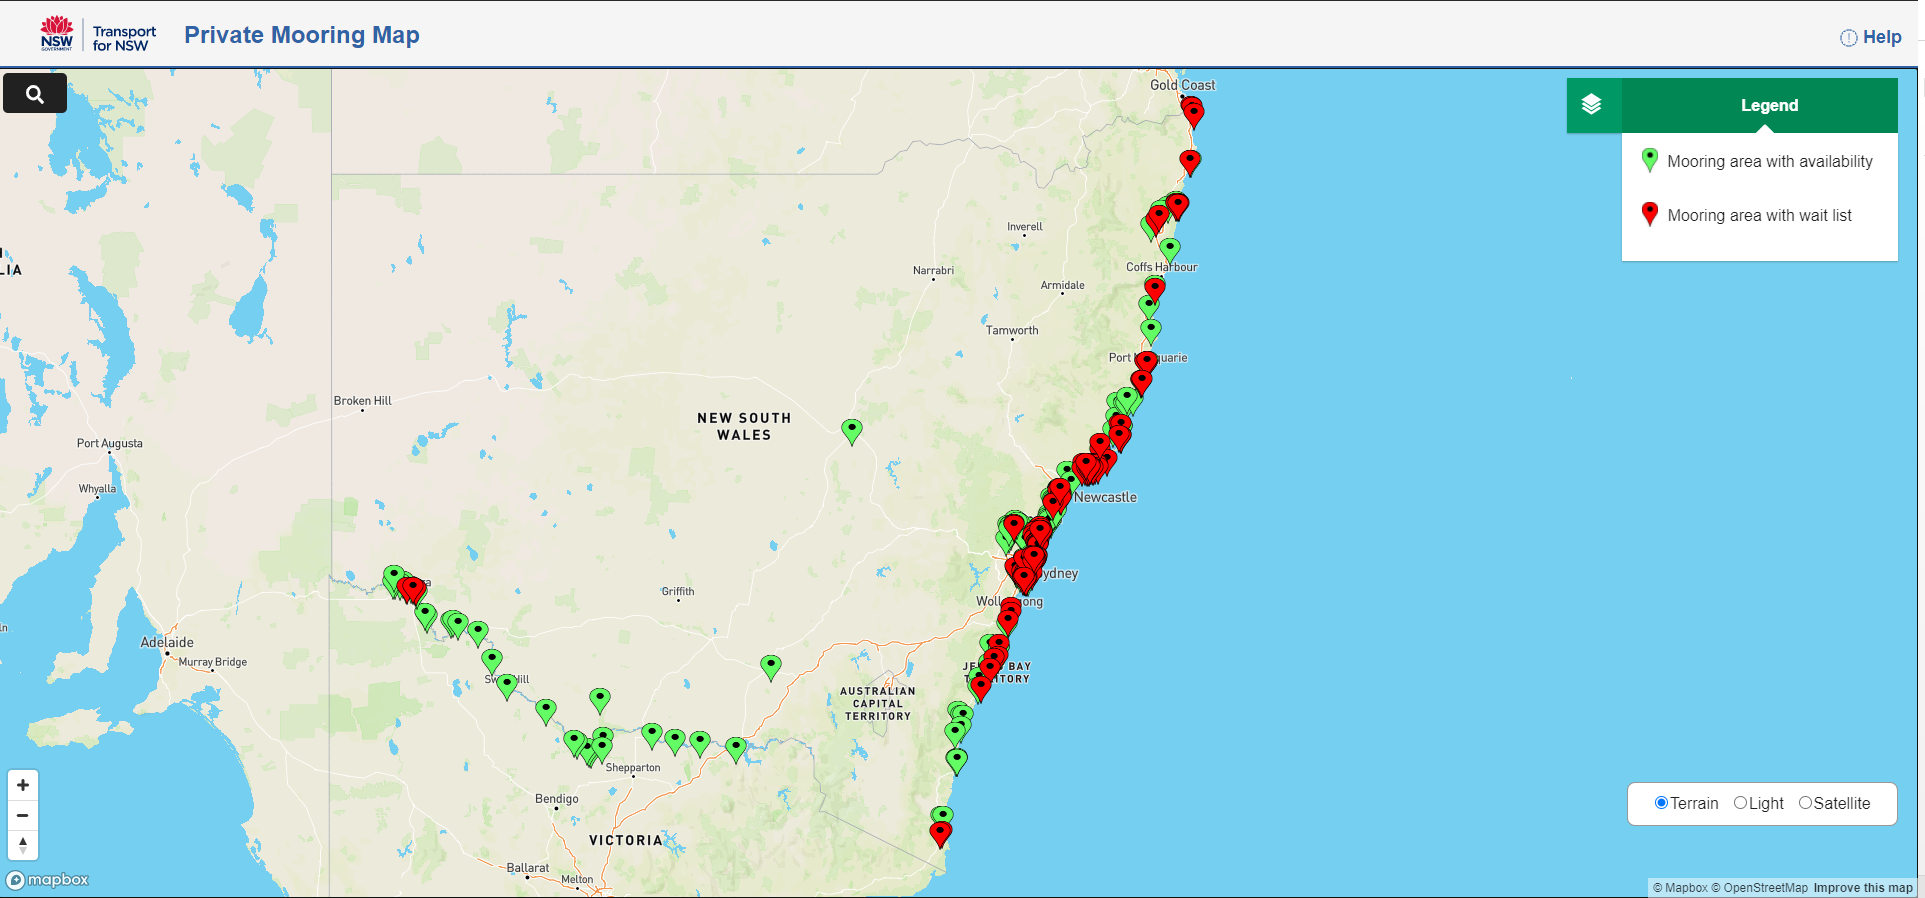12 years ago
- Night Ride Services statistics from 1 Jan 2017 to 31 Dec 2019 released under the formal NSW Government Information Public Access (GIPA) Act 2009. For the latest information visit [Late Night Services](https://transportnsw.info/travel-info/using-public-transport/late-night-services) .12 years ago
- Monthly patronage data for the NSW On Demand bus and electric bike pilots. * The numbers represent total successful trips (ie. where the passenger boarded and alighted the vehicle – excluding customer cancellations, no-shows, and rejected bookings) * Bykko Newcastle runs electric bicycles only * Each pilot is unique and due to varied service offerings, operating days and times, and vehicle numbers and capacity, patronage numbers between pilots are expected to differ and therefore should not be used as the sole indicator when comparing performance between pilots * Data collection and validation processes on the part of both pilot operators and TfNSW are improving continuously, so data may be amended from time to time to ensure that patronage is reported as accurately as possible * Due to robust data validation processes between TfNSW and pilot operators, final patronage figures may not be available until a few weeks after the end of a reporting month12 years ago
- This data is provided by Bus Australia and provides known bus operator fleets in Australia. The information provided covers the various regions in each state, and the list of operators in each region. Detailed information about each operator is also available including full fleet listing, fleet summary, livery summary, buses to be delivered and disposal lists. To access the website, select Go to Resource.12 years ago
- This data set contains station CAD (Computer Aided Design) drawings for the station names **H - L**. The CAD drawings are 2D detailing the layout and platforms of each station. Showing train direction, station entry and exit, facilities and more. The CAD drawings were provided in 2016 so some stations could also be dated/historical in terms of data and details or **unavailable to be published.**422 years ago
- The Walking CVP report investigate how we can encourage customers in NSW to walk more often. The reports identify 4 key areas: 1. Connectivity and flow of footpaths to public transport and centres 2. Pedestrian safety and personal security 3. Health and well being benefits 4. Supporting facilities including complete shade or rain coverage on key routes and at interchanges This report provides a detailed analysis of why the research was conducted, what influences walking in NSW, what is important to the NSW population, and how do needs differ across the NSW population.12 years ago
- This data is part of the strategic transport modelling undertaken for Urban Transport Crowding and Congestion, a supplementary report of the Australian Infrastructure Audit 2019. This project looks at historical data from 2016, and with that data it analyses the trends to predict what congestion will be like in 2031. [Network performance in Sydney, the Hunter and Illawarra](https://www.infrastructureaustralia.gov.au/urban-crowding-congestion-maps-sydney-network) shows interactive maps. The following resources are available, links will be provided that lead you directly to the current source of data. **Major Roads** \* Congestion on major roads during 2016 AM peak \* Congestion on major roads (projected) during 2031 AM peak \* Congestion on major roads during 2016 PM peak \* Congestion on major roads (projected) during 2031 PM peak **All Roads** \* Congestion on all roads during 2016 PM peak \* Congestion on all roads (projected) during 2031 AM peak \* Congestion on all roads during 2016 AM peak \* Congestion on all roads (projected) during 2031 PM peak82 years ago
- **This information is provided by Liverpool City Council.** Liverpool City has almost 5000 car spaces available in or near the city centre. They include free and low-cost options, short and long-stay. Use the Go to Resource to view the data source.12 years ago
- Used Car Safety Ratings help buyers identify the safest models among second-hand vehicles. Safety ratings are based on vehicle records from more than eight million police-reported road crashes. Vehicles labelled Safer Pick not only provide excellent protection for the driver, but cause less serious injuries to other drivers, pedestrians, cyclists and motorcyclists in a collision, and have a lower risk of being involved in a crash. This dataset contains the numerical star ratings which are documented in the report available on the following link: [https://roadsafety.transport.nsw.gov.au/downloads/buyers\_guide\_used\_car\_...](https://roadsafety.transport.nsw.gov.au/downloads/buyers_guide_used_car_safety_ratings.html)12 years ago
- Dataset includes total number of liable car parks, client identifiers, car park location, category, number of spaces and number of liable spaces.12 years ago
- This data is provided by TfNSW Roads and Maritime and provides dates, locations and session times for face to face workshops. The [Roads and Maritime](https://www.rms.nsw.gov.au/maritime/safety-rules/education-program/lifejacket-clinics.html) site provides detailed information about the clinics, the importance of servicing your lifejacket, an online video tutorial, and how to register for a face to face workshop. The clinics are run as part of the NSW Government's 'Wear a Lifejacket' campaign, and in line with the [Maritime Safety Plan](https://future.transport.nsw.gov.au/plans).12 years ago
- This dataset contains a snapshot of commuting patterns for Census day 1996 (Tuesday 6th August). It is a complete enumeration via a self-completion Census form. The scope of JTW is employed persons aged 15 years and over, who were employed during the week before Census night, and counted in the Greater Metropolitan Area (GMA) JTW data may produce slightly different counts to those obtained directly from the Australian Bureau of Statistics (ABS) for the same geographic level due to: * ABS confidentialising process is applied to the data that TPA purchases (randomisation of small cells) * Further validation and adjustment of the data undertaken by TPA * Imputation of records of incomplete addresses to eliminate locality ‘dump’ codes ABS data is used with permission from the Australian Bureau of Statistics352 years ago
- This data set contains station CAD (Computer Aided Design) drawings for the station names **S - V**. The CAD drawings are 2D detailing the layout and platforms of each station. Showing train direction, station entry and exit, facilities and more. The CAD drawings were provided in 2016 so some stations could also be dated/historical in terms of data and details or **unavailable to be published.**372 years ago
- This dataset will no longer be updated. Please use [GTFS-Flex v2](https://opendata.transport.nsw.gov.au/dataset/on-demand-timetables-gtfs) for On Demand boundaries. Basic Polygon layer for On Demand Bus regions that operate around NSW. These are used in the .info Trip Planner. An example of how it is used is shown below: 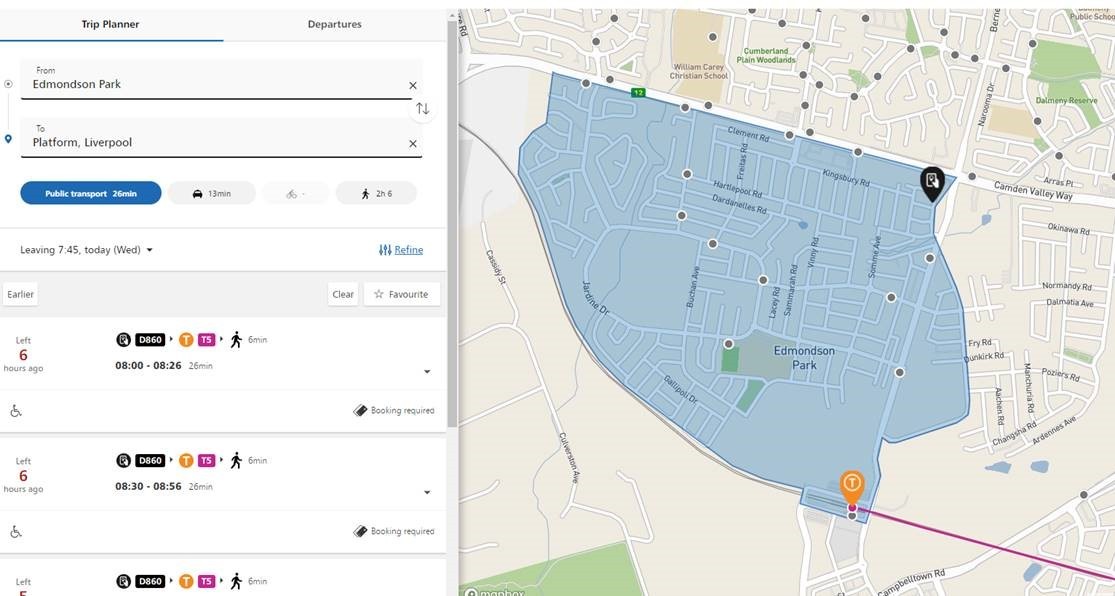32 years ago
- School zones help protect children on their way to and from schools at the times and places where they are often in high numbers. The 40km/h school zones are in force on all days which are not a weekend, a public holiday or a publicly notified school holiday for government schools. The lower speed limit reduces the risk and potential severity of a crash. These are school zone timetables, and school zones operate according to the official school terms, even if the associated school does not.22 years ago
Title
Updated